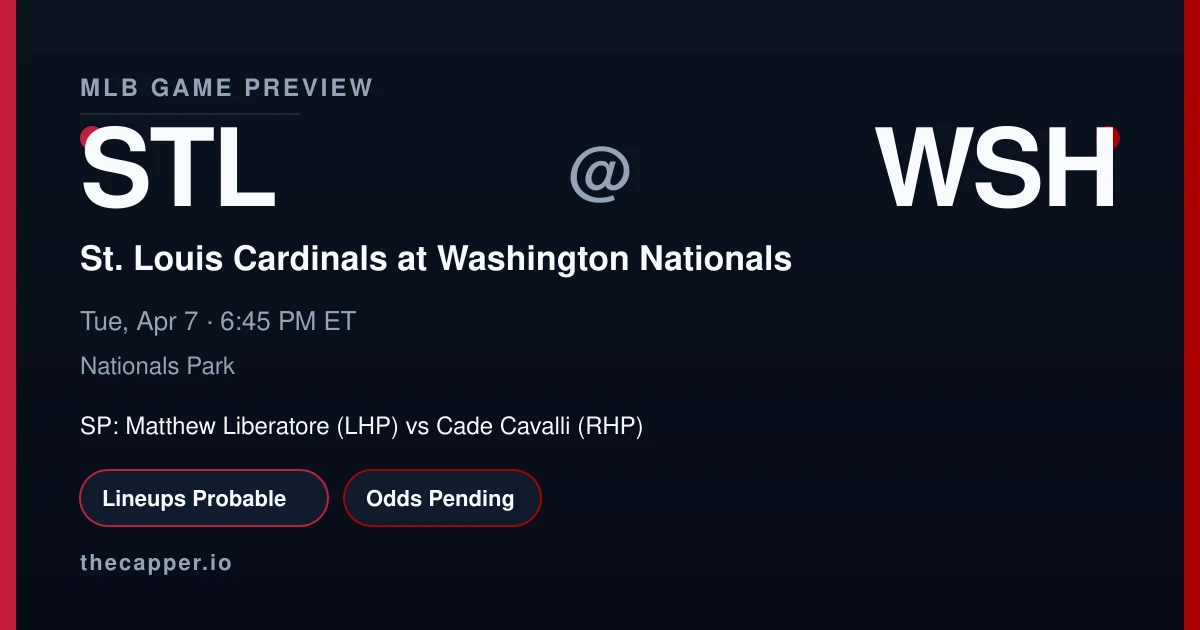
- Starter matchup: Matthew Liberatore (St. Louis Cardinals) vs Cade Cavalli (Washington Nationals).
- Lineup status: projected until official release.
- NRFI model: 51% probability, lean NRFI, +1.4% edge.
Pitching Matchup
On the season, Cade Cavalli holds the ERA edge in this matchup. Matthew Liberatore carries a 3.38 ERA and 1.50 WHIP, while Cade Cavalli sits at 2.51 ERA and 1.47 WHIP.
Strikeout rates: Matthew Liberatore at 5.63 K/9, Cade Cavalli at 6.91 K/9.
K projections: Matthew Liberatore at 4.9 (line 4.5)
Cade Cavalli projected at 3.2 (line 4.5).
Matthew Liberatore has a 71.4% career NRFI rate. No first-inning data available for Cade Cavalli.
This is a LHP vs RHP matchup, creating potential platoon advantages in both lineups.
Strikeout Projections
Our strikeout model weighs pitcher K rate, opponent lineup whiff tendency, park factors, and umpire zone size to project total strikeouts per starter.
Matthew Liberatore (St. Louis Cardinals) is projected for 4.9 strikeouts against a posted line of 4.5. The projection sits 0.4 K above the line, giving the model a Neutral lean at 4/10 confidence.
Win probability on this lean: 50%.
He faces a high-K lineup that strikes out at 24.6% with a 28.3% whiff rate.
Cade Cavalli (Washington Nationals) is projected for 3.2 strikeouts against a posted line of 4.5. The projection sits 1.3 K below the line, giving the model a Neutral lean at 5/10 confidence.
Win probability on this lean: 50%.
He faces a low-K lineup that strikes out at 16.0% with a 23.6% whiff rate.
The Washington Nationals lineup is more vulnerable to strikeouts in this matchup. Washington Nationals batters K at 24.6%, St. Louis Cardinals batters at 16.0%.
NRFI & First 5 Analysis
Our NRFI model analyzes both starting pitchers' first-inning profiles, the top-of-order hitters in each lineup, the umpire's historical zone, and environmental factors to produce a probability estimate. For this game, the model assigns a 51.4% probability of no runs in the first inning, compared to the market's implied probability of 50.0%.
- That creates a slim 1.4% edge on NRFI.
- The best available line is NRFI +100 / YRFI -122 at FanDuel.
- Publication tier: slate_only.
- Home plate umpire Derek Thomas runs a average zone. See the umpire section below for full career data.
- Our NRFI model sits at 11-9 (55.0%) on official picks this season.
Prop Edges
Lineup & Matchup Breakdown
Lineups are projected as of this writing.
Lineup K vulnerability: 16.0% strikeout rate, 23.6% whiff rate.
Lineup K vulnerability: 24.6% strikeout rate, 28.3% whiff rate.
Ballpark, Weather & Umpire
- Nationals Park carries a 0.99 run factor (neutral).
- Home run factor: 0.96 — the park neutral for HR power.
- Park notes: Potomac River proximity; Humid DC climate; Relatively neutral dimensions.
- First pitch forecast: 56F with 12 mph winds from the NW. Humidity: 20%.
- Wind advisory: 12 mph winds from the NW may impact fly balls.
- Home plate umpire: Derek Thomas.
- Career NRFI rate: 49.3% across 71 games tracked.
- Zone tendency: Slightly tight.
- K factor: 0.981 (league average strikeouts in his games).
Run Projections & Total
Our projection model puts the total at 5.1 combined runs, with St. Louis Cardinals projected for 2.6 and Washington Nationals for 2.4.
No total line posted yet for comparison.
The run projection is essentially a coin flip between these two teams.