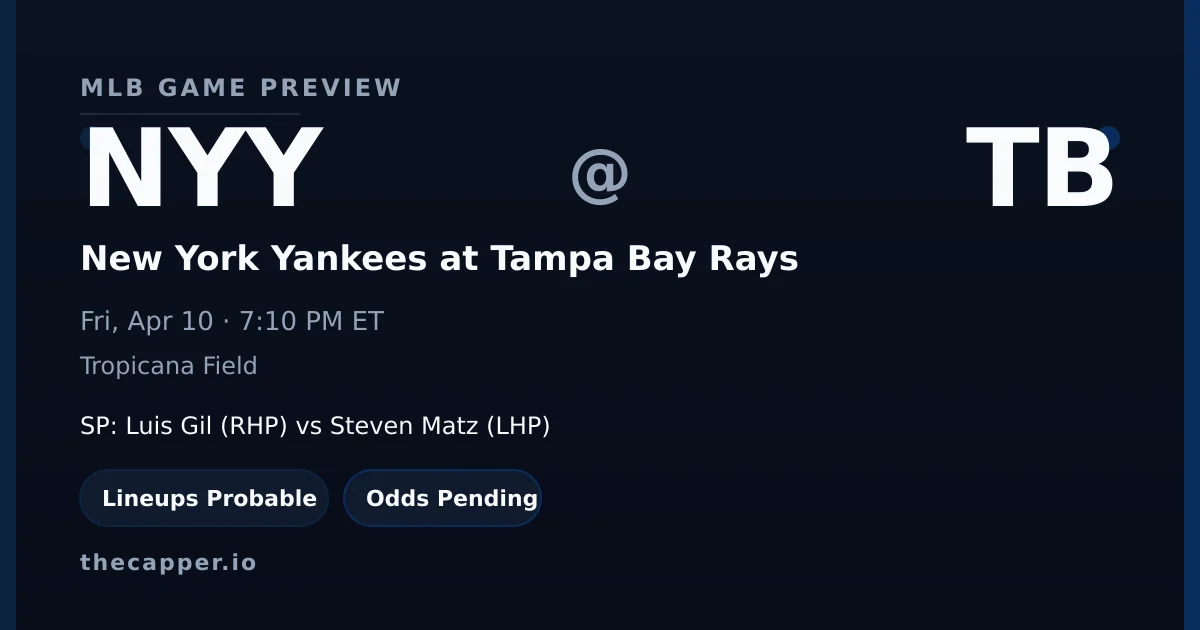
- Starter matchup: Luis Gil (New York Yankees) vs Steven Matz (Tampa Bay Rays).
- Lineup status: projected until official release.
- NRFI model: 59% probability, lean NRFI, +8.2% edge.
Pitching Matchup
- K projections: Luis Gil at 4.1 (line 4.5)
- Steven Matz projected at 5.2 (line 4.5).
- First-inning scoring: Luis Gil holds a 81.6% career NRFI rate, Steven Matz at 75.0%. Combined average: 78.3%.
- This is a RHP vs LHP matchup, creating potential platoon advantages in both lineups.
Strikeout Projections
Our strikeout model weighs pitcher K rate, opponent lineup whiff tendency, park factors, and umpire zone size to project total strikeouts per starter.
Luis Gil (New York Yankees) is projected for 4.1 strikeouts against a posted line of 4.5. The projection sits 0.4 K below the line, giving the model a Neutral lean at 5/10 confidence.
Win probability on this lean: 50%.
He faces a moderate-K lineup that strikes out at 22.0% with a 28.0% whiff rate.
Steven Matz (Tampa Bay Rays) is projected for 5.2 strikeouts against a posted line of 4.5. The projection sits 0.7 K above the line, giving the model a Neutral lean at 5/10 confidence.
Win probability on this lean: 50%.
He faces a moderate-K lineup that strikes out at 22.0% with a 28.0% whiff rate.
The New York Yankees lineup is more vulnerable to strikeouts in this matchup. Tampa Bay Rays batters K at 22.0%, New York Yankees batters at 22.0%.
NRFI & First 5 Analysis
Our NRFI model analyzes both starting pitchers' first-inning profiles, the top-of-order hitters in each lineup, the umpire's historical zone, and environmental factors to produce a probability estimate. For this game, the model assigns a 58.7% probability of no runs in the first inning, compared to the market's implied probability of 50.5%.
- That creates a moderate 8.2% edge on NRFI.
- The best available line is NRFI -102 / YRFI -120 at FanDuel.
- This qualifies as a playable in our publication system.
The home plate umpire for this game has not yet been assigned. MLB typically posts assignments the morning of game day. This article will be updated with full umpire data in the game-day pass.
Our NRFI model sits at 12-12 (50.0%) on official picks this season.
Prop Edges
Lineup & Matchup Breakdown
Lineups are projected as of this writing.
Lineup K vulnerability: 22.0% strikeout rate, 28.0% whiff rate.
Lineup K vulnerability: 22.0% strikeout rate, 28.0% whiff rate.
Ballpark, Weather & Umpire
- Tropicana Field carries a 0.97 run factor (neutral).
- Home run factor: 0.93 — the park suppresses HR power.
- Park notes: Inflated dome with catwalks; Catwalk interference possible; Turf field affects speed.
Climate controlled. Roof expected closed. Standard 72F conditions, no wind factor.
Home plate umpire: Not yet assigned. Updated game-day morning.
Run Projections & Total
- Our projection model puts the total at 5.6 combined runs, with New York Yankees projected for 3.1 and Tampa Bay Rays for 2.6.
- That's 2.9 runs below the posted total of 8.5, suggesting a lean toward the Under.
- The run projection favors New York Yankees by 0.5 runs.