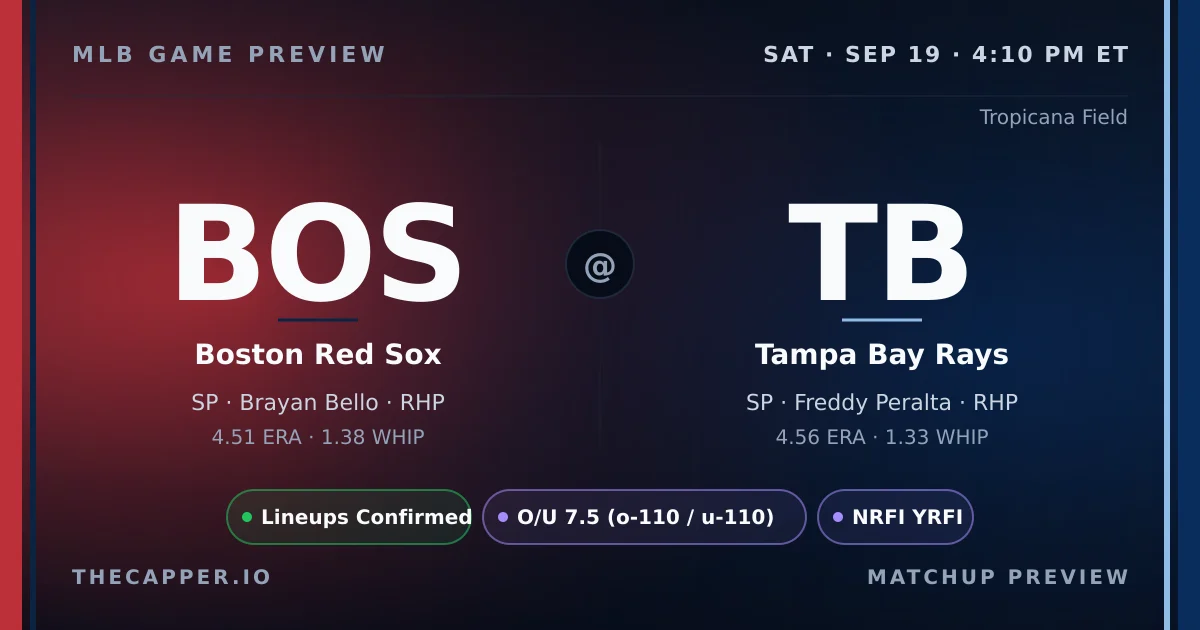
- Starter matchup: Brayan Bello (Boston Red Sox) vs Freddy Peralta (Tampa Bay Rays).
- Lineup status: confirmed by both teams.
- NRFI model: 46% probability, lean YRFI, -13.1% edge.
Pitching Matchup
On the season, Brayan Bello holds the ERA edge in this matchup. Brayan Bello carries a 4.51 ERA and 1.38 WHIP, while Freddy Peralta sits at 4.56 ERA and 1.33 WHIP.
Strikeout rates: Brayan Bello at 7.17 K/9, Freddy Peralta at 8.36 K/9.
K projections: Brayan Bello at 3.3 (line 4.0)
Freddy Peralta projected at 4.1 (line 4.5).
First-inning scoring: Brayan Bello holds a 57.9% career NRFI rate, Freddy Peralta at 67.6%. Combined average: 62.7%.
Both starters throw from the R side, limiting platoon splits for either lineup.
Strikeout Projections
Our strikeout model weighs pitcher K rate, opponent lineup whiff tendency, park factors, and umpire zone size to project total strikeouts per starter.
Brayan Bello (Boston Red Sox) is projected for 3.3 strikeouts against a posted line of 4.0. The projection is close to the line with no actionable edge.
He faces a moderate-K lineup that strikes out at 22.5% with a 28.0% whiff rate.
Freddy Peralta (Tampa Bay Rays) is projected for 4.1 strikeouts against a posted line of 4.5. The projection is close to the line with no actionable edge.
He faces a moderate-K lineup that strikes out at 23.0% with a 28.0% whiff rate.
The Boston Red Sox lineup is more vulnerable to strikeouts in this matchup. Tampa Bay Rays batters K at 22.5%, Boston Red Sox batters at 23.0%.
NRFI & First 5 Analysis
Our NRFI model analyzes both starting pitchers' first-inning profiles, the top-of-order hitters in each lineup, the umpire's historical zone, and environmental factors to produce a probability estimate. For this game, the model assigns a 46.3% probability of no runs in the first inning, compared to the market's implied probability of 59.4%.
- That creates a slim -13.1% edge on YRFI.
- The best available line is NRFI -146 / YRFI +110 at FanDuel.
- Home plate umpire Jeremie Rehak runs a wide zone. See the umpire section below for full career data.
- Our NRFI model sits at 158-148 (51.6%) on official picks this season.
Prop Edges
Lineup & Matchup Breakdown
Lineups are confirmed as of this writing.
Boston Red Sox K vulnerability: 23.0% strikeout rate, 28.0% whiff rate.
Tampa Bay Rays K vulnerability: 22.5% strikeout rate, 28.0% whiff rate.
Ballpark, Weather & Umpire
- Tropicana Field carries a 0.97 run factor (neutral).
- Home run factor: 0.93 — the park suppresses HR power.
- Park notes: Inflated dome with catwalks; Catwalk interference possible; Turf field affects speed.
Climate controlled. Roof expected closed. Standard 72F conditions, no wind factor.
- Home plate umpire: Jeremie Rehak.
- Career NRFI rate: 20.0% across 5 games tracked.
- Zone tendency: Average.
- K factor: 1.003 (league average strikeouts in his games).
Run Projections & Total
- Our projection model puts the total at 5.2 combined runs, with Boston Red Sox projected for 2.6 and Tampa Bay Rays for 2.6.
- That's 2.3 runs below the posted total of 7.5, suggesting a lean toward the Under.
- The run projection is essentially a coin flip between these two teams.