Beta Free full access during beta. All models, tools, and daily picks included.
Early Preview Lineups: Probable Odds Pending 6 min read

Philadelphia Phillies vs San Francisco Giants Preview

Philadelphia Phillies vs San Francisco Giants preview with model projections: Aaron Nola projected 5.9 K (line 5.5), NRFI probability 58%. Full breakdown inside.

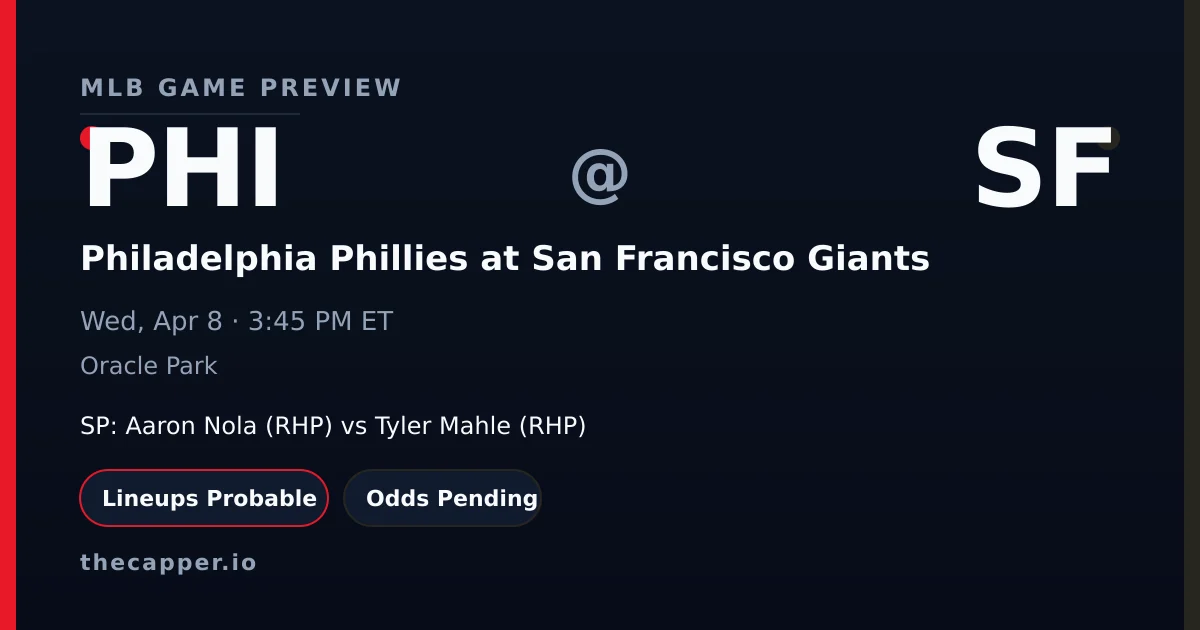
Philadelphia Phillies at San Francisco Giants MLB game preview for April 8, 2026
PHI
Philadelphia Phillies
Aaron Nola RHP
@
3:45 PM ET
Oracle Park
SF
San Francisco Giants
Tyler Mahle RHP
Last updated Wednesday, April 8, 2026

Key Facts

Matchup
Philadelphia Phillies at San Francisco Giants
Date
Wednesday, April 8, 2026
First Pitch
3:45 PM ET
Venue
Oracle Park
Probable Starters
Aaron Nola (RHP) vs Tyler Mahle (RHP)
Lineups
Probable
Last Updated
Apr 7, 10:11 PM ET

Betting Board

Lines not yet posted
Sportsbooks have not published markets for this matchup yet. Check back closer to first pitch, or see today's model-backed picks for games with live odds.

Model Angles

NRFI Model
NRFI · 58%
+12.9% edge · playable
Projected Total
5.1
model combined runs
Park Factor
0.93
Pitcher friendly · HR 0.86
First Pitch Weather
68°F
7.5 mph WNW
The Phillies arrive at Oracle Park riding momentum while the Giants continue to sink, and the pitching matchup screams Philadelphia advantage. Aaron Nola brings his elite 12.71 strikeouts per nine to face a Giants offense that's managed just three wins through eleven games, while San Francisco counters with Tyler Mahle and his alarming 7.00 ERA. The difference in command tells the story: Nola's 1.15 WHIP reflects precision, while Mahle's 1.78 mark shows a pitcher still searching for consistency after his injury comeback. The Giants have dropped four straight and can't seem to find answers on either side of the ball. Oracle Park's pitcher-friendly 0.93 run environment typically favors well-located stuff, which plays directly into Nola's strengths. He's carving up lineups with that strikeout rate while keeping baserunners to a minimum, exactly what you want from your starter in a ballpark that suppresses offense. Mahle's struggling to miss bats at the same clip, sitting at just 9.00 K/9, and when you're allowing that many runners aboard in a park that should help you, the foundation is shaky. Philadelphia's won six of ten to start the season and catches San Francisco at the perfect time. The full breakdown examines lineup depth, bullpen advantages, and why this total deserves attention.

Pitching Matchup

PHI Away
Aaron Nola
RHP · 1-1 · 3 GS
ERA
3.63
WHIP
1.10
K/9
9.87
IP
17.1
Career: 3.83 ERA · 1.15 WHIP · 9.84 K/9
NRFI: 73.0%
1st Inn ERA: 5.20
SF Home
Tyler Mahle
RHP · 0-2 · 3 GS
ERA
4.30
WHIP
1.57
K/9
9.20
IP
14.2
Career: 4.07 ERA · 1.29 WHIP · 9.22 K/9
NRFI: 84.2%
1st Inn ERA: 1.42

On the season, Aaron Nola holds the ERA edge in this matchup. Aaron Nola carries a 3.63 ERA and 1.10 WHIP, while Tyler Mahle sits at 4.30 ERA and 1.57 WHIP.
Strikeout rates: Aaron Nola at 9.87 K/9, Tyler Mahle at 9.20 K/9.
K projections: Aaron Nola at 5.9 (line 5.5)
Tyler Mahle projected at 4.2 (line 4.5).
First-inning scoring: Aaron Nola holds a 73.0% career NRFI rate, Tyler Mahle at 84.2%. Combined average: 78.6%.
Both starters throw from the R side, limiting platoon splits for either lineup.

Strikeout Projections

Aaron Nola vs SF
Proj: 5.9Line: 5.5
+0.4
Confidence:
Tyler Mahle vs PHI
Proj: 4.2Line: 4.5
-0.3
Confidence:
View all K projections on SlateIQ

Our strikeout model weighs pitcher K rate, opponent lineup whiff tendency, park factors, and umpire zone size to project total strikeouts per starter.

Aaron Nola (Philadelphia Phillies) is projected for 5.9 strikeouts against a posted line of 5.5. The projection sits 0.4 K above the line, giving the model a Neutral lean at 5/10 confidence.
Win probability on this lean: 50%.
He faces a moderate-K lineup that strikes out at 21.3% with a 23.9% whiff rate.

Tyler Mahle (San Francisco Giants) is projected for 4.2 strikeouts against a posted line of 4.5. The projection sits 0.3 K below the line, giving the model a Neutral lean at 5/10 confidence.
Win probability on this lean: 50%.
He faces a low-K lineup that strikes out at 19.4% with a 26.1% whiff rate.

The San Francisco Giants lineup is more vulnerable to strikeouts in this matchup. San Francisco Giants batters K at 21.3%, Philadelphia Phillies batters at 19.4%.

NRFI & First 5 Analysis

NRFI Model
58.0%
probability of NRFI
+12.9%
market edge
Signal
Market implied: 45.1%Model: 58.0%
First 5 Innings
2.8est. F5 runs
PHI
3.63 ERA
5.7 inn/start
SF
4.30 ERA
4.7 inn/start
F5 lean: Slight PHI
PHI K Projection
Aaron Nola
5.9proj
Line: 5.5
+0.4 NEUTRAL
Confidence
SF K Projection
Tyler Mahle
4.2proj
Line: 4.5
-0.3 NEUTRAL
Confidence
Explore all model projections

Our NRFI model analyzes both starting pitchers' first-inning profiles, the top-of-order hitters in each lineup, the umpire's historical zone, and environmental factors to produce a probability estimate. For this game, the model assigns a 58.0% probability of no runs in the first inning, compared to the market's implied probability of 45.1%.

  • That creates a strong 12.9% edge on NRFI.
  • The best available line is NRFI +122 / YRFI -162 at FanDuel.
  • This qualifies as a playable in our publication system.
  • Home plate umpire Todd Tichenor runs a wide zone. See the umpire section below for full career data.
  • Our NRFI model sits at 12-11 (52.2%) on official picks this season.

Prop Edges

5 model signals detected
Hits
65.1%
Kyle SchwarberStrong Signal
Home Run Elite 0.5
19.1%
Rafael DeversStrong Signal
Home Run Elite 0.5
18.9%
Home Run Very Strong 0.5
15.4%
Home Run Very Strong 0.5
15.8%
See all today's picks and edges

Lineup & Matchup Breakdown

Philadelphia Phillies Projected
K%: 19.4
2Kyle SchwarberLLF
Whiff rate: 26.1%Team page
San Francisco Giants Projected
K%: 21.3
3Luis ArraezLIF
4Rafael DeversLDH
5Willy AdamesRSS
6Matt ChapmanR3B
Whiff rate: 23.9%Team page
Batter vs Pitcher matchup tool

Lineups are projected as of this writing.

Lineup K vulnerability: 19.4% strikeout rate, 26.1% whiff rate.

Lineup K vulnerability: 21.3% strikeout rate, 23.9% whiff rate.

Ballpark, Weather & Umpire

Oracle Park
Run Factor0.93
HR Factor0.86
Full park profile
Home Plate Umpire
Todd Tichenor
Average NRFI: 53.9% 89 games
Full umpire profile
Hourly Game Forecast
68°
3 PM
8 mph
WNW
71°
4 PM
6 mph
WNW
71°
5 PM
12 mph
WNW
69°
6 PM
15 mph
WNW
  • Oracle Park carries a 0.93 run factor (pitcher-friendly).
  • Home run factor: 0.86 — the park suppresses HR power.
  • Park notes: McCovey Cove in right field; Bay breezes suppress HRs; Chilly climate.

First pitch forecast: 68F with 8 mph winds from the WNW. Humidity: 68%.

  • Home plate umpire: Todd Tichenor.
  • Career NRFI rate: 53.9% across 89 games tracked.
  • Zone tendency: Average.
  • K factor: 0.967 (below average strikeouts in his games).

Run Projections & Total

Our projection model puts the total at 5.1 combined runs, with Philadelphia Phillies projected for 2.7 and San Francisco Giants for 2.4.
No total line posted yet for comparison.
The run projection is essentially a coin flip between these two teams.

The Bottom Line
The Phillies are the clear play here, with Aaron Nola's elite strikeout rate (12.71 K/9) and solid peripherals facing a struggling Giants lineup riding a four-game skid. Back Philadelphia on the run line at -1.5, as Tyler Mahle's 7.00 ERA and 1.78 WHIP make him highly exploitable for a Phillies offense that just won their last game.
This preview is generated from thecapper.io projection models and publicly available data. All projections are model estimates, not guarantees. Gamble responsibly. If you or someone you know has a gambling problem, call 1-800-GAMBLER.