Beta Free full access during beta. All models, tools, and daily picks included.
Game-Day Update Lineups: Probable Odds Posted 6 min read

New York Yankees vs Tampa Bay Rays Preview

Expert preview for Yankees at Rays featuring Max Fried (1.35 ERA) against Nick Martinez (2.25 ERA). Projections, NRFI analysis, and betting angles for Thursd...

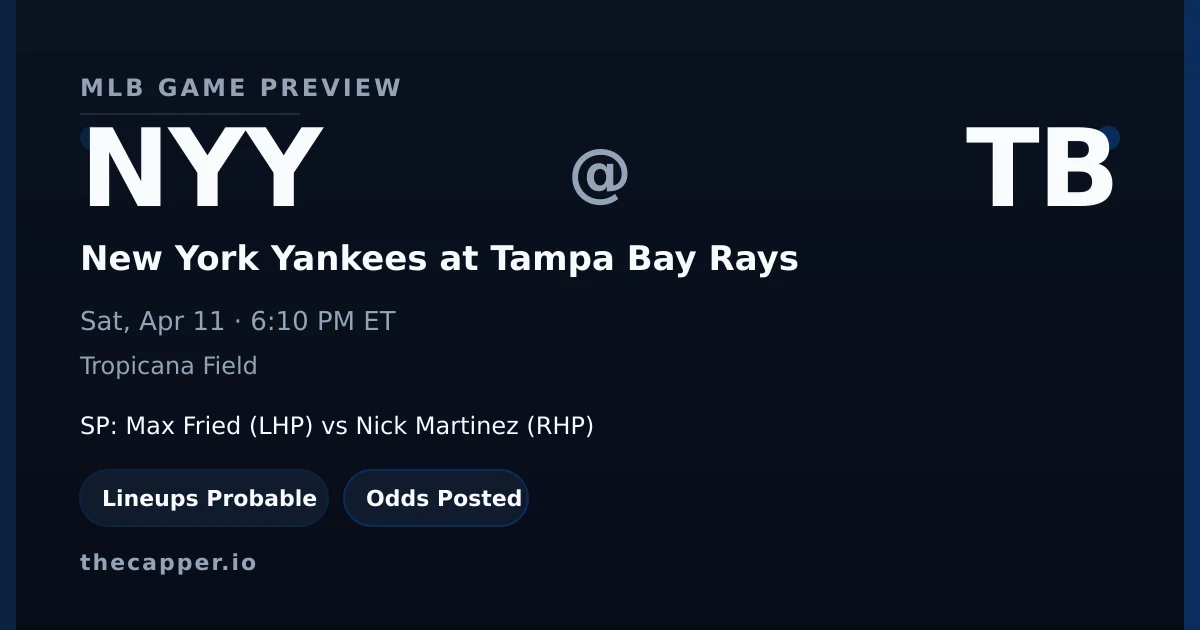
New York Yankees at Tampa Bay Rays MLB game preview for April 11, 2026
NYY
New York Yankees
Max Fried LHP
@
6:10 PM ET
Tropicana Field
TB
Tampa Bay Rays
Nick Martinez RHP
Last updated Saturday, April 11, 2026

Key Facts

Matchup
New York Yankees at Tampa Bay Rays
Date
Saturday, April 11, 2026
First Pitch
6:10 PM ET
Venue
Tropicana Field
Probable Starters
Max Fried (LHP) vs Nick Martinez (RHP)
Lineups
Probable
Last Updated
Apr 11, 7:09 AM ET

Betting Board

Moneyline
NYY -167
TB +155
Total
Over 7.5 -115
Under 7.5 -105
Run Line
NYY -1.5 +100
TB +1.5 -120

Model Angles

NRFI Model
NRFI · 60%
+5.9% edge · top pick
Projected Total
5.6
model combined runs
Park Factor
0.97
Neutral · HR 0.93
First Pitch Weather
Roof
Climate controlled
The Yankees bring an 8-5 record into Thursday's series opener at Tropicana Field, where Max Fried will take the mound looking to build on his exceptional early-season performance. The lefthander has posted a microscopic 1.35 ERA with a 0.75 WHIP through his first turns in pinstripes, though his 6.30 strikeouts per nine innings suggests he's pitching to contact. Tampa Bay counters with Nick Martinez, whose 2.25 ERA and 0.67 WHIP reflect similarly stingy results. The Rays enter at 6-7 after winning their last outing, seeking to build momentum against a Yankees club that has gone 1-2 in its last three games. Oddsmakers project a low-scoring affair with a total of just 5.6 runs and favor New York to account for 3.1 of them. The 72-degree temperature and calm conditions inside the dome provide neutral environmental factors.
  • Fried's elite ratios anchoring Yankees rotation early
  • Martinez matching stingy numbers for Tampa Bay
  • NRFI probability sits at 61 percent with significant edge

Pitching Matchup

NYY Away
Max Fried
LHP · 2-0 · 3 GS
ERA
1.35
WHIP
0.75
K/9
6.30
IP
20.0
Career: 3.00 ERA · 1.14 WHIP · 8.72 K/9
NRFI: 78.0%
1st Inn ERA: 3.09
TB Home
Nick Martinez
RHP · 0-0 · 2 GS
ERA
2.25
WHIP
0.67
K/9
5.25
IP
12.0
Career: 4.13 ERA · 1.29 WHIP · 6.40 K/9
NRFI: 72.4%
1st Inn ERA: 3.71

On the season, Max Fried holds the ERA edge in this matchup. Max Fried carries a 1.35 ERA and 0.75 WHIP, while Nick Martinez sits at 2.25 ERA and 0.67 WHIP.
Strikeout rates: Max Fried at 6.30 K/9, Nick Martinez at 5.25 K/9.
K projections: Max Fried at 5.9 (line 5.5)
Nick Martinez projected at 4.6 (line 4.5).
First-inning scoring: Max Fried holds a 78.0% career NRFI rate, Nick Martinez at 72.4%. Combined average: 75.2%.
This is a LHP vs RHP matchup, creating potential platoon advantages in both lineups.

Strikeout Projections

Max Fried vs TB
Proj: 5.9Line: 5.5
+0.4
Confidence:
Nick Martinez vs NYY
Proj: 4.6Line: 4.5
+0.1
Confidence:
View all K projections on SlateIQ

Our strikeout model weighs pitcher K rate, opponent lineup whiff tendency, park factors, and umpire zone size to project total strikeouts per starter.

Max Fried (New York Yankees) is projected for 5.9 strikeouts against a posted line of 5.5. The projection sits 0.4 K above the line, giving the model a Neutral lean at 5/10 confidence.
Win probability on this lean: 50%.
He faces a moderate-K lineup that strikes out at 20.1% with a 21.9% whiff rate.

Nick Martinez (Tampa Bay Rays) is projected for 4.6 strikeouts against a posted line of 4.5. The projection sits 0.1 K above the line, giving the model a Neutral lean at 5/10 confidence.
Win probability on this lean: 50%.
He faces a moderate-K lineup that strikes out at 22.1% with a 26.6% whiff rate.

The New York Yankees lineup is more vulnerable to strikeouts in this matchup. Tampa Bay Rays batters K at 20.1%, New York Yankees batters at 22.1%.

NRFI & First 5 Analysis

NRFI Model
60.0%
probability of NRFI
+5.9%
market edge
Strong Signal
Market implied: 54.1%Model: 60.0%
First 5 Innings
3.1est. F5 runs
NYY
1.35 ERA
6.7 inn/start
TB
2.25 ERA
6.0 inn/start
F5 lean: Slight NYY
NYY K Projection
Max Fried
5.9proj
Line: 5.5
+0.4 NEUTRAL
Confidence
TB K Projection
Nick Martinez
4.6proj
Line: 4.5
+0.1 NEUTRAL
Confidence
Explore all model projections

Our NRFI model analyzes both starting pitchers' first-inning profiles, the top-of-order hitters in each lineup, the umpire's historical zone, and environmental factors to produce a probability estimate. For this game, the model assigns a 60.0% probability of no runs in the first inning, compared to the market's implied probability of 54.1%.

  • That creates a moderate 5.9% edge on NRFI.
  • The best available line is NRFI -118 / YRFI -104 at FanDuel.
  • This qualifies as a top pick in our publication system.
  • Home plate umpire Shane Livensparger runs a average zone. See the umpire section below for full career data.
  • Our NRFI model sits at 4-8 (33.3%) on official picks this season.

Prop Edges

3 model signals detected
Home Run Elite 0.5
23.1%
Home Run Elite 0.5
18.1%
Home Run Very Strong 0.5
13.8%
See all today's picks and edges

Lineup & Matchup Breakdown

New York Yankees Projected
K%: 22.1
1Trent GrishamLCF
2Aaron JudgeRRF
6Giancarlo StantonRDH
Whiff rate: 26.6%Team page
Tampa Bay Rays Projected
K%: 20.1
Whiff rate: 21.9%Team page
Batter vs Pitcher matchup tool

Lineups are projected as of this writing.

Lineup K vulnerability: 22.1% strikeout rate, 26.6% whiff rate.

Lineup K vulnerability: 20.1% strikeout rate, 21.9% whiff rate.

Ballpark, Weather & Umpire

Tropicana Field
Run Factor0.97
HR Factor0.93
Full park profile
Home Plate Umpire
Shane Livensparger
Average NRFI: 40.9% 66 games
Full umpire profile
  • Tropicana Field carries a 0.97 run factor (neutral).
  • Home run factor: 0.93 — the park suppresses HR power.
  • Park notes: Inflated dome with catwalks; Catwalk interference possible; Turf field affects speed.

Climate controlled. Roof expected closed. Standard 72F conditions, no wind factor.

  • Home plate umpire: Shane Livensparger.
  • Career NRFI rate: 40.9% across 66 games tracked.
  • Zone tendency: Average.
  • K factor: 0.930 (below average strikeouts in his games).

Run Projections & Total

  • Our projection model puts the total at 5.6 combined runs, with New York Yankees projected for 3.1 and Tampa Bay Rays for 2.5.
  • That's 1.9 runs below the posted total of 7.5, suggesting a lean toward the Under.
  • The run projection favors New York Yankees by 0.7 runs.
The Bottom Line
Two starters posting sub-2.30 ERAs set the stage for a pitcher-friendly contest. The projected total of 5.6 runs reflects confidence in both arms, while the strong NRFI probability underscores expectations for early zeros on the scoreboard.
This preview is generated from thecapper.io projection models and publicly available data. All projections are model estimates, not guarantees. Gamble responsibly. If you or someone you know has a gambling problem, call 1-800-GAMBLER.