Beta Free full access during beta. All models, tools, and daily picks included.
Game-Day Update Lineups: Probable Odds Posted 5 min read

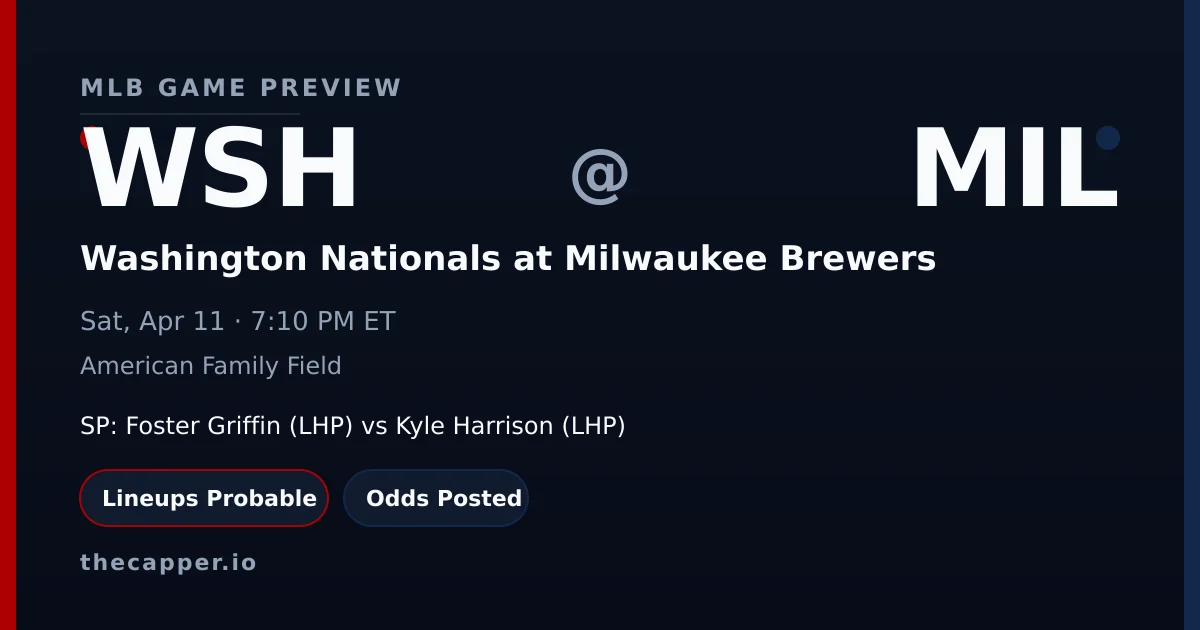
Washington Nationals vs Milwaukee Brewers Preview

Washington Nationals (5-8) visit Milwaukee Brewers (8-5) Thursday at 7:10 PM ET. Foster Griffin (2.70 ERA) opposes Kyle Harrison (2.61 ERA, 12.19 K/9) in low...

Washington Nationals at Milwaukee Brewers MLB game preview for April 11, 2026
WSH
Washington Nationals
Foster Griffin LHP
@
7:10 PM ET
American Family Field
MIL
Milwaukee Brewers
Kyle Harrison LHP
Last updated Saturday, April 11, 2026

Key Facts

Matchup
Washington Nationals at Milwaukee Brewers
Date
Saturday, April 11, 2026
First Pitch
7:10 PM ET
Venue
American Family Field
Probable Starters
Foster Griffin (LHP) vs Kyle Harrison (LHP)
Lineups
Probable
Last Updated
Apr 11, 7:09 AM ET

Betting Board

Moneyline
WSH +155
MIL -170
Total
Over 8 -110
Under 8 -110
Run Line
WSH +1.5 -140
MIL -1.5 +116

Model Angles

NRFI Model
YRFI · 49%
-3.1% edge
Projected Total
5.2
model combined runs
Park Factor
0.98
Neutral · HR 1.06
First Pitch Weather
Roof
Climate controlled
The Washington Nationals visit American Family Field on Thursday night to take on the Milwaukee Brewers in a 7:10 PM ET contest featuring left-handed starters on both sides. Foster Griffin takes the ball for Washington carrying a 2.70 ERA and 1.30 WHIP with 9.90 strikeouts per nine innings. Kyle Harrison counters for Milwaukee with a 2.61 ERA, 0.97 WHIP, and impressive 12.19 K/9 rate. The Nationals enter at 5-8 after a win in their last outing, while the Brewers stand at 8-5 following a . The projected total sits at a low 5.2 runs with Washington projected for 2.5 and Milwaukee for 2.7. Conditions at American Family Field call for 72-degree temperature with no wind, and the park factor rates neutral at 0.98 runs.
  • Kyle Harrison carries elite strikeout rate of 12.19 per nine with strong 0.97 WHIP
  • Foster Griffin counters with solid 2.70 ERA and 9.90 K/9 for Washington
  • Low 5.2-run total projects pitcher-friendly environment with neutral park factor

Pitching Matchup

WSH Away
Foster Griffin
LHP · 1-0 · 2 GS
ERA
2.70
WHIP
1.30
K/9
9.90
IP
10.0
Career: 4.50 ERA · 1.39 WHIP · 8.00 K/9
MIL Home
Kyle Harrison
LHP · 1-0 · 2 GS
ERA
2.61
WHIP
0.97
K/9
12.19
IP
10.1
Career: 4.30 ERA · 1.30 WHIP · 9.00 K/9
NRFI: 70.4%
1st Inn ERA: 4.67

On the season, Kyle Harrison holds the ERA edge in this matchup. Foster Griffin carries a 2.70 ERA and 1.30 WHIP, while Kyle Harrison sits at 2.61 ERA and 0.97 WHIP.
Strikeout rates: Foster Griffin at 9.90 K/9, Kyle Harrison at 12.19 K/9.
K projections: Foster Griffin at 3.4 (line 4.5)
Kyle Harrison projected at 5.8 (line 5.5).
Kyle Harrison has a 70.4% career NRFI rate. No first-inning data available for Foster Griffin.
Both starters throw from the L side, limiting platoon splits for either lineup.

Strikeout Projections

Foster Griffin vs MIL
Proj: 3.4Line: 4.5
-1.1
Confidence:
Kyle Harrison vs WSH
Proj: 5.8Line: 5.5
+0.3
Confidence:
View all K projections on SlateIQ

Our strikeout model weighs pitcher K rate, opponent lineup whiff tendency, park factors, and umpire zone size to project total strikeouts per starter.

Foster Griffin (Washington Nationals) is projected for 3.4 strikeouts against a posted line of 4.5. The projection sits 1.1 K below the line, giving the model a Neutral lean at 5/10 confidence.
Win probability on this lean: 50%.
He faces a moderate-K lineup that strikes out at 21.1% with a 30.5% whiff rate.

Kyle Harrison (Milwaukee Brewers) is projected for 5.8 strikeouts against a posted line of 5.5. The projection sits 0.3 K above the line, giving the model a Neutral lean at 5/10 confidence.
Win probability on this lean: 50%.
He faces a high-K lineup that strikes out at 24.6% with a 28.3% whiff rate.

The Washington Nationals lineup is more vulnerable to strikeouts in this matchup. Milwaukee Brewers batters K at 21.1%, Washington Nationals batters at 24.6%.

NRFI & First 5 Analysis

NRFI Model
49.2%
probability of YRFI
+-3.1%
market edge
Monitor
Market implied: 52.4%Model: 49.2%
First 5 Innings
2.9est. F5 runs
WSH
2.70 ERA
5.0 inn/start
MIL
2.61 ERA
5.0 inn/start
F5 lean: Even matchup
WSH K Projection
Foster Griffin
3.4proj
Line: 4.5
-1.1 NEUTRAL
Confidence
MIL K Projection
Kyle Harrison
5.8proj
Line: 5.5
+0.3 NEUTRAL
Confidence
Explore all model projections

Our NRFI model analyzes both starting pitchers' first-inning profiles, the top-of-order hitters in each lineup, the umpire's historical zone, and environmental factors to produce a probability estimate. For this game, the model assigns a 49.2% probability of no runs in the first inning, compared to the market's implied probability of 52.4%.

  • That creates a slim -3.1% edge on YRFI.
  • The best available line is NRFI -110 / YRFI -110 at FanDuel.
  • Publication tier: slate_only.
  • Home plate umpire Bruce Dreckman runs a average zone. See the umpire section below for full career data.
  • Our NRFI model sits at 4-8 (33.3%) on official picks this season.

Lineup & Matchup Breakdown

Washington Nationals Projected
K%: 24.6
Whiff rate: 28.3%Team page
Milwaukee Brewers Projected
K%: 21.1
Whiff rate: 30.5%Team page
Batter vs Pitcher matchup tool

Lineups are projected as of this writing.

Lineup K vulnerability: 24.6% strikeout rate, 28.3% whiff rate.

Lineup K vulnerability: 21.1% strikeout rate, 30.5% whiff rate.

Ballpark, Weather & Umpire

American Family Field
Run Factor0.98
HR Factor1.06
Full park profile
Home Plate Umpire
Bruce Dreckman
Average NRFI: 50.0% 82 games
Full umpire profile
  • American Family Field carries a 0.98 run factor (neutral).
  • Home run factor: 1.06 — the park elevates HR power.
  • Park notes: 6th easiest HR but 26th in runs; Elevated position; Retractable roof.
  • Roof: Retractable.

Climate controlled. Roof expected closed. Standard 72F conditions, no wind factor.

  • Home plate umpire: Bruce Dreckman.
  • Career NRFI rate: 50.0% across 82 games tracked.
  • Zone tendency: Average.
  • K factor: 0.978 (below average strikeouts in his games).

Run Projections & Total

  • Our projection model puts the total at 5.2 combined runs, with Washington Nationals projected for 2.5 and Milwaukee Brewers for 2.7.
  • That's 2.8 runs below the posted total of 8.0, suggesting a lean toward the Under.
  • The run projection is essentially a coin flip between these two teams.
The Bottom Line
Two capable left-handers square off in a matchup projecting minimal run production. Harrison holds the strikeout advantage while Griffin brings quality ratios of his own in a contest with a total sitting well below six runs.
This preview is generated from thecapper.io projection models and publicly available data. All projections are model estimates, not guarantees. Gamble responsibly. If you or someone you know has a gambling problem, call 1-800-GAMBLER.