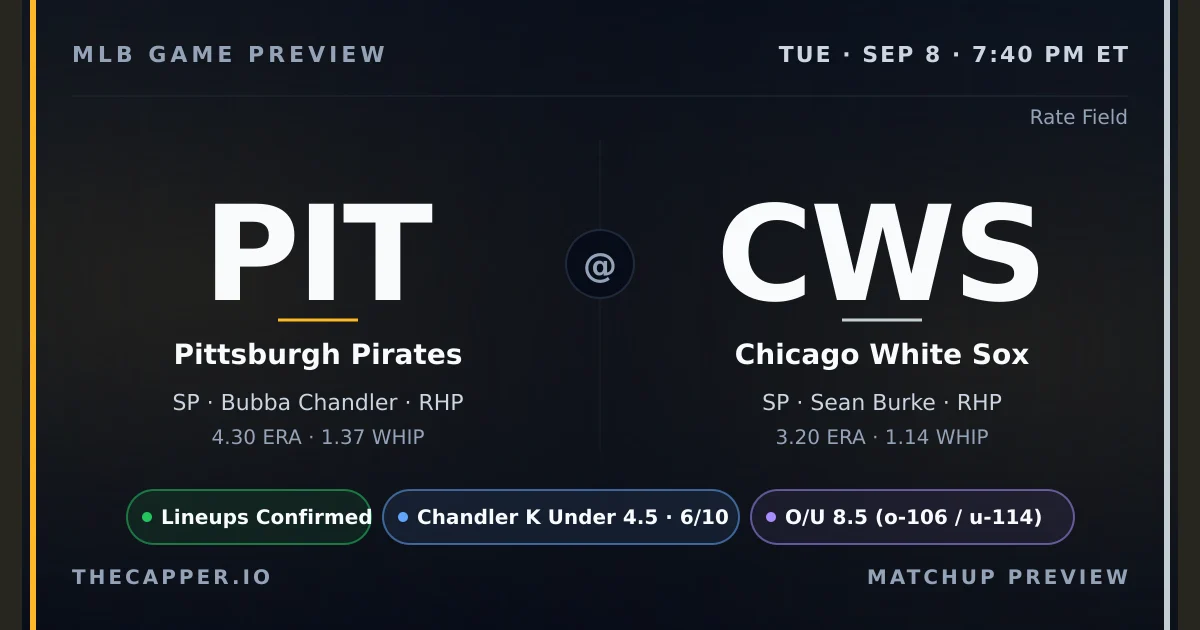
The Pirates and White Sox meet at Rate Field on Friday night with both clubs riding one-game winning streaks and a razor-thin run environment in the forecast. Pittsburgh sits 71-73 while Chicago comes in at 75-68. The projected total of 2.8 runs is almost entirely one-sided: the model gives the Pirates 2.8 and the White Sox 0.0, a lopsided distribution that immediately flags scoring uncertainty. Weather sits at 82 degrees with an 8 mph wind out of the south-southeast, and the park factor is neutral at 1.00. Both bullpens enter fresh with fatigue scores of 0 out of 100. Bubba Chandler takes the ball for Pittsburgh carrying a 4.30ERA, 1.37WHIP and 8.01 strikeouts per nine innings. The K model projects him at 3.1 strikeouts against a posted line of 4.5, which leans Under with medium confidence at 6 out of 10. Sean Burke counters for Chicago with a cleaner ledger: 3.20ERA, 1.14WHIP and 9.72 strikeouts per nine. His K projection is 4.2 against a 5.5 line, also an Under lean at the same 6-out-of-10 confidence. Neither starter has been a dominant force, but Burke holds the edge on surface numbers. The NRFI sits at 50 percent probability with a negative 1.5 percent edge on the yes-runs-first-inning side, which translates to no advantage in either direction. First-inning history offers some context: Chandler has posted a 75 percent NRFI rate across 28 games, while Burke clocks in at 74 percent over 27 outings. Barrel-rate leaders for the evening include Oneil Cruz at 23.3 percent, Konnor Griffin at 16.7, and Bryan Reynolds at 9.1. The combination of low projections, tight NRFI numbers and Under-leaning K props frames this as a game where runs may be scarce and strikeout totals restrained.
Both K props project Under with 6-out-of-10 confidence
NRFI sits at 50 percent with no meaningful edge
Projected total is 2.8 runs, split 2.8 to 0.0
Pitching Matchup
PITAway
Bubba Chandler
RHP · 6-9 · 26 GS
ERA
4.30
WHIP
1.37
K/9
8.01
IP
136.0
Career: 4.25 ERA · 1.28 WHIP · 8.18 K/9
NRFI: 75.0%
1st Inn ERA: 4.18
CWSHome
Sean Burke
RHP · 8-6 · 24 GS
ERA
3.20
WHIP
1.14
K/9
9.72
IP
154.2
Career: 3.54 ERA · 1.27 WHIP · 9.41 K/9
NRFI: 63.4%
1st Inn ERA: 6.08
On the season, Sean Burke holds the ERA edge in this matchup. Bubba Chandler carries a 4.30ERA and 1.37WHIP, while Sean Burke sits at 3.20ERA and 1.14WHIP. Strikeout rates: Bubba Chandler at 8.01K/9, Sean Burke at 9.72K/9. K projections: Bubba Chandler at 3.1 (line 4.5) Sean Burke projected at 4.4 (line 6.5). First-inning scoring: Bubba Chandler holds a 75.0% career NRFI rate, Sean Burke at 63.4%. Combined average: 69.2%. Both starters throw from the R side, limiting platoon splits for either lineup.
Our strikeout model weighs pitcher K rate, opponent lineup whiff tendency, park factors, and umpire zone size to project total strikeouts per starter.
Bubba Chandler (Pittsburgh Pirates) is projected for 3.1 strikeouts against a posted line of 4.5. The projection sits 1.4 K below the line, giving the model an Under lean. He faces a high-K lineup that strikes out at 25.1% with a 28.0% whiff rate.
Sean Burke (Chicago White Sox) is projected for 4.4 strikeouts against a posted line of 6.5. The projection sits 2.1 K below the line, giving the model an Under lean. He faces a high-K lineup that strikes out at 26.7% with a 28.0% whiff rate.
The Pittsburgh Pirates lineup is more vulnerable to strikeouts in this matchup. Chicago White Sox batters K at 25.1%, Pittsburgh Pirates batters at 26.7%.
Our NRFI model analyzes both starting pitchers' first-inning profiles, the top-of-order hitters in each lineup, the umpire's historical zone, and environmental factors to produce a probability estimate. For this game, the model assigns a 50.4% probability of no runs in the first inning, compared to the market's implied probability of 51.5%.
That creates a slim -1.1% edge on YRFI.
The best available line is NRFI -106 / YRFI -114 at FanDuel.
Home plate umpire Jim Wolf runs a average zone. See the umpire section below for full career data.
Our NRFI model sits at 148-132 (52.9%) on official picks this season.
Home run factor: 0.99 — the park neutral for HR power.
Park notes: Symmetric dimensions; Wind factor from Lake Michigan.
First pitch forecast: 81F with 7 mph winds from the SSE. Humidity: 46%.
Home plate umpire: Jim Wolf.
Career NRFI rate: 40.0% across 5 games tracked.
Zone tendency: Tight.
K factor: 0.800 (below average strikeouts in his games).
Run Projections & Total
Our projection model puts the total at 2.8 combined runs, with Pittsburgh Pirates projected for 2.8 and Chicago White Sox for 0.0.
That's 5.7 runs below the posted total of 8.5, suggesting a lean toward the Under.
The run projection favors Pittsburgh Pirates by 2.8 runs.
The Bottom Line
The model sees almost no offense from Chicago and limited scoring from Pittsburgh, with both strikeout props leaning Under at medium confidence. Burke's superior ratios give him the pitching edge, but the K model still projects him below his 5.5 line. The NRFI offers no value at 50 percent probability and a negative edge on yes-runs. The key risk is the lopsided run projection: a 2.8-to-0.0 split suggests the White Sox are forecast to be completely shut out, which raises the stakes on any early Chicago offense. With both bullpens rested and the park neutral, focus on the Under side of both K totals rather than chasing the NRFI or side action in a matchup where the model sees little scoring upside.
This preview is generated from thecapper.io projection models and publicly available data. All projections are model estimates, not guarantees. Gamble responsibly. If you or someone you know has a gambling problem, call 1-800-GAMBLER.