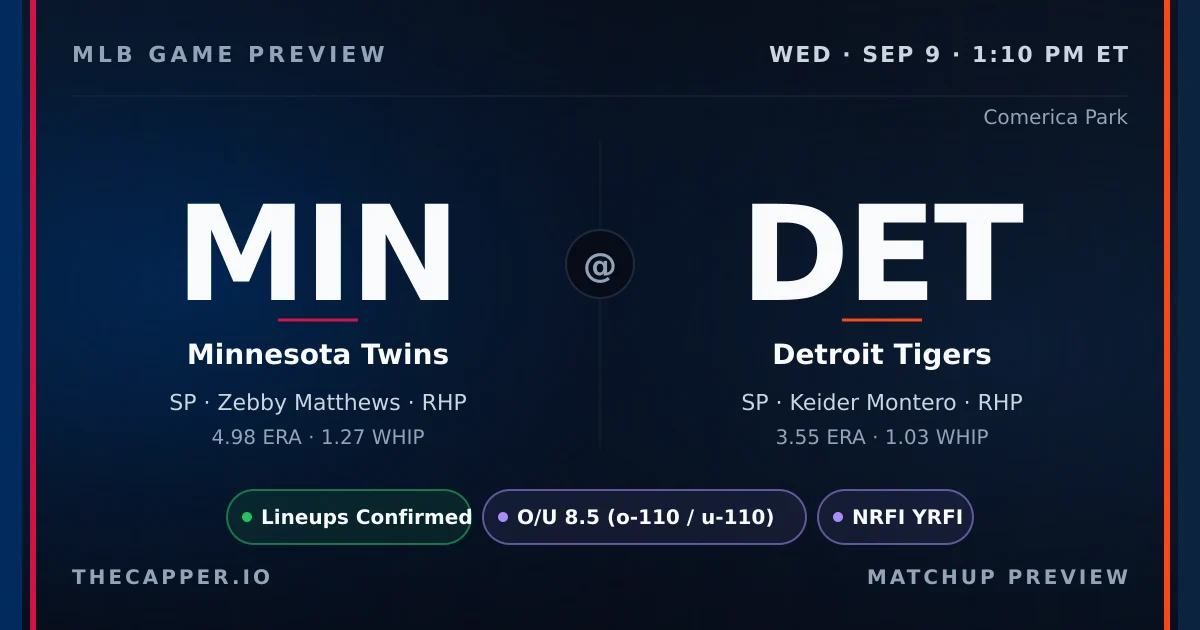
The Minnesota Twins carry a one-game winning streak into Comerica Park to face the Detroit Tigers, who dropped their last outing. First pitch is scheduled for 1:10 PM ET with the projected total sitting at 5.2 runs, split evenly at 2.6 per side. Zebby Matthews takes the ball for Minnesota with a 4.69ERA and 1.25WHIP, striking out 7.46 per nine innings. Keider Montero counters for Detroit with a 3.52ERA, a 1.03WHIP, and 6.04 strikeouts per nine. The park factor at Comerica checks in at 0.98 runs, just a tick below neutral. Weather looks clean: 76 degrees with a 10-mile-per-hour wind blowing southwest. The bullpen fatigue picture tilts heavily toward Detroit. Minnesota's relief corps sits at 92 out of 100 on the fatigue scale with Connor Prielipp unavailable, while Detroit registers 52 out of 100. That gap could matter late if either starter falters early. The strikeout props show modest projections. Matthews is projected at 3.7 strikeouts against a line of 4.5, grading neutral with five-out-of-ten confidence. Montero sits at 2.8 projected versus a 3.5 line, also neutral with four-out-of-ten confidence. Neither pitcher generates loud model edges. The NRFI model assigns a 48 percent probability to a scoreless first inning with a minus-5.7 percent edge on the yes-runs-first-inning side. Matthews owns a 55 percent NRFI rate across 20 first-inning starts. Montero has been sharper in the opening frame, posting an 83 percent NRFI rate over 23 starts. Recent Comerica Park trends point the opposite direction: the last ten games at the venue have averaged 8.9 runs, with the over cashing 57 percent of the time and the NRFI hitting 70 percent. A few bat-versus-pitch matchups stand out. Luke Keaschall enters hitting.297 against right-handed pitching. Ryan Jeffers posts a 10.8 percent barrel rate, and Kody Clemens checks in at 19.4 percent.
On the season, Keider Montero holds the ERA edge in this matchup. Zebby Matthews carries a 4.98ERA and 1.27WHIP, while Keider Montero sits at 3.55ERA and 1.03WHIP. Strikeout rates: Zebby Matthews at 7.47K/9, Keider Montero at 6.00K/9. K projections: Zebby Matthews at 3.7 (line 4.5) Keider Montero projected at 2.8 (line 3.5). First-inning scoring: Zebby Matthews holds a 50.3% career NRFI rate, Keider Montero at 78.2%. Combined average: 64.2%. Both starters throw from the R side, limiting platoon splits for either lineup.
Our strikeout model weighs pitcher K rate, opponent lineup whiff tendency, park factors, and umpire zone size to project total strikeouts per starter.
Zebby Matthews (Minnesota Twins) is projected for 3.7 strikeouts against a posted line of 4.5. The projection is close to the line with no actionable edge. He faces a high-K lineup that strikes out at 27.2% with a 28.0% whiff rate.
Keider Montero (Detroit Tigers) is projected for 2.8 strikeouts against a posted line of 3.5. The projection is close to the line with no actionable edge. He faces a moderate-K lineup that strikes out at 21.1% with a 28.0% whiff rate.
The Detroit Tigers lineup is more vulnerable to strikeouts in this matchup. Detroit Tigers batters K at 27.2%, Minnesota Twins batters at 21.1%.
Our NRFI model analyzes both starting pitchers' first-inning profiles, the top-of-order hitters in each lineup, the umpire's historical zone, and environmental factors to produce a probability estimate. For this game, the model assigns a 44.1% probability of no runs in the first inning, compared to the market's implied probability of 52.4%.
That creates a slim -8.3% edge on YRFI.
The best available line is NRFI -110 / YRFI -110 at FanDuel.
Home plate umpire Tyler Jones runs a tight zone. See the umpire section below for full career data.
Our NRFI model sits at 150-133 (53.0%) on official picks this season.
Comerica Park carries a 0.98 run factor (neutral).
Home run factor: 0.95 — the park neutral for HR power.
Park notes: Very deep center field (420ft); Tiered elevation; Wind patterns from Great Lakes.
First pitch forecast: 73F with 9 mph winds from the W. Humidity: 93%.
Wind advisory: 9 mph winds from the W may impact fly balls.
Home plate umpire: Tyler Jones. Zone tendency: average.
Run Projections & Total
Our projection model puts the total at 5.4 combined runs, with Minnesota Twins projected for 2.6 and Detroit Tigers for 2.8.
That's 3.1 runs below the posted total of 8.5, suggesting a lean toward the Under.
The run projection is essentially a coin flip between these two teams.
The Bottom Line
The 5.2 projected total and sub-1.00 park factor suggest a pitcher-friendly environment, but neither starter commands loud model confidence. Matthews and Montero grade neutral on strikeout props with modest projections, and the NRFI model sees no meaningful edge despite Montero's strong 83 percent first-inning rate. The bullpen fatigue gap is stark: Minnesota sits at 92 out of 100 with one arm unavailable, while Detroit registers 52. That disparity could become the story if either starter exits early. Recent Comerica trends favor offense, with 8.9 runs per game and a 57 percent over rate in the last ten. The mismatch between model projection and venue context makes this a pass on the total and props alike.
This preview is generated from thecapper.io projection models and publicly available data. All projections are model estimates, not guarantees. Gamble responsibly. If you or someone you know has a gambling problem, call 1-800-GAMBLER.