Beta Free full access during beta. All models, tools, and daily picks included.
Early Preview Lineups: Projected Odds Posted 7 min read

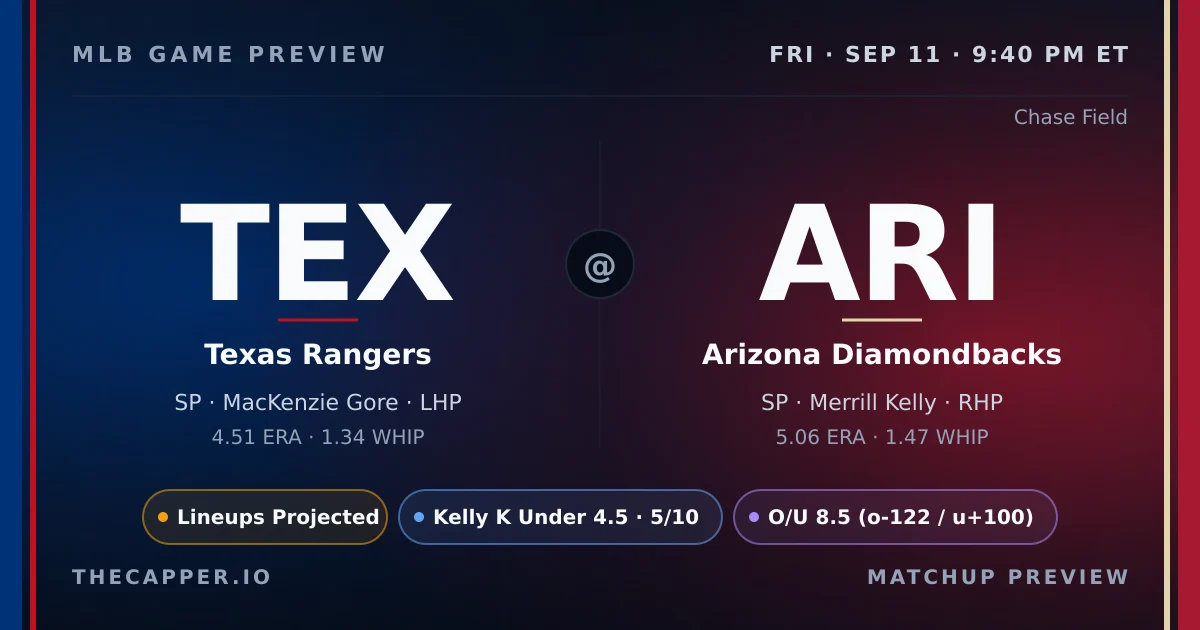
Texas Rangers vs Arizona Diamondbacks Preview

TEX at ARI 2026-09-11 preview: probable pitchers, projected lineups, NRFI/F5 model picks, weather, ballpark, and umpire context.

Texas Rangers at Arizona Diamondbacks MLB game preview for September 11, 2026
TEX
Texas Rangers
MacKenzie Gore LHP
@
9:40 PM ET
Chase Field
ARI
Arizona Diamondbacks
Merrill Kelly RHP
Last updated Friday, September 11, 2026
Final This game has finished. Read the recap for final score, model grades, and box score.

Key Facts

Matchup
Texas Rangers at Arizona Diamondbacks
Date
Friday, September 11, 2026
First Pitch
9:40 PM ET
Venue
Chase Field
Probable Starters
MacKenzie Gore (LHP) vs Merrill Kelly (RHP)
Lineups
Projected
Odds Snapshot
Sep 11, 9:41 PM ET
Last Updated
Sep 11, 7:33 AM ET

Betting Board

Snapshot Sep 11, 9:41 PM ET
Moneyline
TEX +102
ARI -111
Total
Over 8.5 -122
Under 8.5 +100
Run Line
TEX -1.5 +158
ARI +1.5 -192

Model Angles

NRFI Model
YRFI · 46%
-8.8% edge
Projected Total
5.6
model combined runs
Park Factor
1.05
Neutral · HR 1.09
First Pitch Weather
Roof
Climate controlled
Texas arrives at 72-75 and riding a two-game losing streak, while Arizona sits nine games better at 78-69 after dropping its most recent contest. Neither club has named a starter, so bullpen usage and availability will shape this one from the first pitch. The projected total sits at 5.6 runs, split evenly at 2.8 per side. Chase Field carries a 1.05 park factor, a modest boost but not a launching pad. Recent park trends tell a louder story. The last ten games at Chase have averaged 11.3 runs, with the Over cashing at a 62 percent clip and the NRFI hitting just 44 percent of the time. That divergence between projection and recent outcome creates friction worth noting. Bullpen health tilts hard toward Arizona. Texas checks in with a fatigue rating of 86 out of 100, signaling a tired relief corps after consecutive games. Arizona counters at zero, suggesting full rest and maximum availability. That gap matters most in a game where starting-pitcher length remains unknown. If either side leans on an opener or a bulk reliever, the fresher bullpen holds the clearer edge. The NRFI model registers 54 percent probability with a 6.2 percent edge on the no-run outcome in the first inning. That edge is real but modest, particularly when weighed against the recent Chase Field first-inning track record. Weather is neutral: 72 degrees with zero wind at first pitch. The absence of named starters keeps variance wide, but the bullpen mismatch and recent park scoring trends offer the cleanest angles into this late Wednesday contest in the desert.
  • NRFI model shows 54 percent probability, 6.2 percent edge
  • Texas bullpen fatigue at 86, Arizona rested at zero
  • Chase Field last ten games averaged 11.3 runs, Over 62 percent

Pitching Matchup

TEX Away
LHP · 8-10 · 30 GS
ERA
4.51
WHIP
1.34
K/9
9.70
IP
157.2
Career: 4.27 ERA · 1.39 WHIP · 9.90 K/9
NRFI: 71.2%
1st Inn ERA: 5.14
ARI Home
RHP · 9-13 · 26 GS
ERA
5.06
WHIP
1.47
K/9
6.03
IP
147.2
Career: 3.93 ERA · 1.23 WHIP · 7.86 K/9
NRFI: 68.5%
1st Inn ERA: 5.22

On the season, MacKenzie Gore holds the ERA edge in this matchup. MacKenzie Gore carries a 4.51 ERA and 1.34 WHIP, while Merrill Kelly sits at 5.06 ERA and 1.47 WHIP.
Strikeout rates: MacKenzie Gore at 9.70 K/9, Merrill Kelly at 6.03 K/9.
K projections: MacKenzie Gore at 3.8 (line 4.5)
Merrill Kelly projected at 3.3 (line 4.5).
First-inning scoring: MacKenzie Gore holds a 71.2% career NRFI rate, Merrill Kelly at 68.5%. Combined average: 69.8%.
This is a LHP vs RHP matchup, creating potential platoon advantages in both lineups.

Strikeout Projections

MacKenzie Gore vs ARI
Proj: 3.8Line: 4.5
-0.7
Confidence:
Merrill Kelly vs TEX
Proj: 3.3Line: 4.5
-1.2
Confidence:
View all K projections on SlateIQ

Our strikeout model weighs pitcher K rate, opponent lineup whiff tendency, park factors, and umpire zone size to project total strikeouts per starter.

MacKenzie Gore (Texas Rangers) is projected for 3.8 strikeouts against a posted line of 4.5. The projection is close to the line with no actionable edge.
He faces a moderate-K lineup that strikes out at 22.6% with a 28.0% whiff rate.

Merrill Kelly (Arizona Diamondbacks) is projected for 3.3 strikeouts against a posted line of 4.5. The projection sits 1.2 K below the line, giving the model an Under lean.
He faces a high-K lineup that strikes out at 24.7% with a 28.0% whiff rate.

The Texas Rangers lineup is more vulnerable to strikeouts in this matchup. Arizona Diamondbacks batters K at 22.6%, Texas Rangers batters at 24.7%.

NRFI & First 5 Analysis

NRFI Model
46.1%
probability of YRFI
+-8.8%
market edge
Monitor
Market implied: 54.9%Model: 46.1%
First 5 Innings
3.1est. F5 runs
TEX
4.51 ERA
5.2 inn/start
ARI
5.06 ERA
5.7 inn/start
F5 lean: Slight TEX
TEX K Projection
MacKenzie Gore
3.8proj
Line: 4.5
-0.7 NEUTRAL
Confidence
ARI K Projection
Merrill Kelly
3.3proj
Line: 4.5
-1.2 UNDER
Confidence
Explore all model projections

Our NRFI model analyzes both starting pitchers' first-inning profiles, the top-of-order hitters in each lineup, the umpire's historical zone, and environmental factors to produce a probability estimate. For this game, the model assigns a 46.1% probability of no runs in the first inning, compared to the market's implied probability of 54.9%.

  • That creates a slim -8.8% edge on YRFI.
  • The best available line is NRFI -122 / YRFI +100 at FanDuel.
  • Home plate umpire Brian Walsh runs a average zone. See the umpire section below for full career data.
  • Our NRFI model sits at 153-136 (52.9%) on official picks this season.

Prop Edges

3 model signals detected
Hits
61.7%
Ketel MarteStrong Signal
Home Run Elite 0.5
15.2%
Merrill Kelly
Strikeouts Under 4.5
See all today's picks and edges

Lineup & Matchup Breakdown

Texas Rangers Projected
K%: 24.7
Whiff rate: 28.0%Team page
Arizona Diamondbacks Projected
K%: 22.6
2Ketel MarteS2B
Whiff rate: 28.0%Team page
Batter vs Pitcher matchup tool

Lineups are projected as of this writing.

Texas Rangers K vulnerability: 24.7% strikeout rate, 28.0% whiff rate.

Arizona Diamondbacks K vulnerability: 22.6% strikeout rate, 28.0% whiff rate.

Ballpark, Weather & Umpire

Chase Field
Run Factor1.05
HR Factor1.09
Full park profile
Home Plate Umpire
Brian Walsh
Wide NRFI: 83.3% 6 games
Full umpire profile
  • Chase Field carries a 1.05 run factor (neutral).
  • Home run factor: 1.09 — the park elevates HR power.
  • Park notes: High desert elevation (1100ft); Retractable roof; Hot climate.
  • Roof: Retractable.

Climate controlled. Roof expected closed. Standard 72F conditions, no wind factor.

  • Home plate umpire: Brian Walsh.
  • Career NRFI rate: 83.3% across 6 games tracked.
  • Zone tendency: Wide.
  • K factor: 0.995 (league average strikeouts in his games).

Run Projections & Total

  • Our projection model puts the total at 5.6 combined runs, with Texas Rangers projected for 2.8 and Arizona Diamondbacks for 2.8.
  • That's 2.9 runs below the posted total of 8.5, suggesting a lean toward the Under.
  • The run projection is essentially a coin flip between these two teams.
The Bottom Line
The betting angle hinges on bullpen depth and park context. Arizona holds a fatigue edge of 86 points, a decisive margin when neither team has announced a starter. The NRFI model posts a 6.2 percent edge at 54 percent probability, but recent Chase Field data shows first-inning runs landing 56 percent of the time across the last ten home dates. That tension between model and environment is the key risk. The total projection of 5.6 runs sits well below the recent 11.3-run park average, creating a gap worth examining. Focus on the bullpen mismatch and the park scoring trends rather than chasing phantom starter data.
This preview is generated from thecapper.io projection models and publicly available data. All projections are model estimates, not guarantees. Gamble responsibly. If you or someone you know has a gambling problem, call 1-800-GAMBLER.