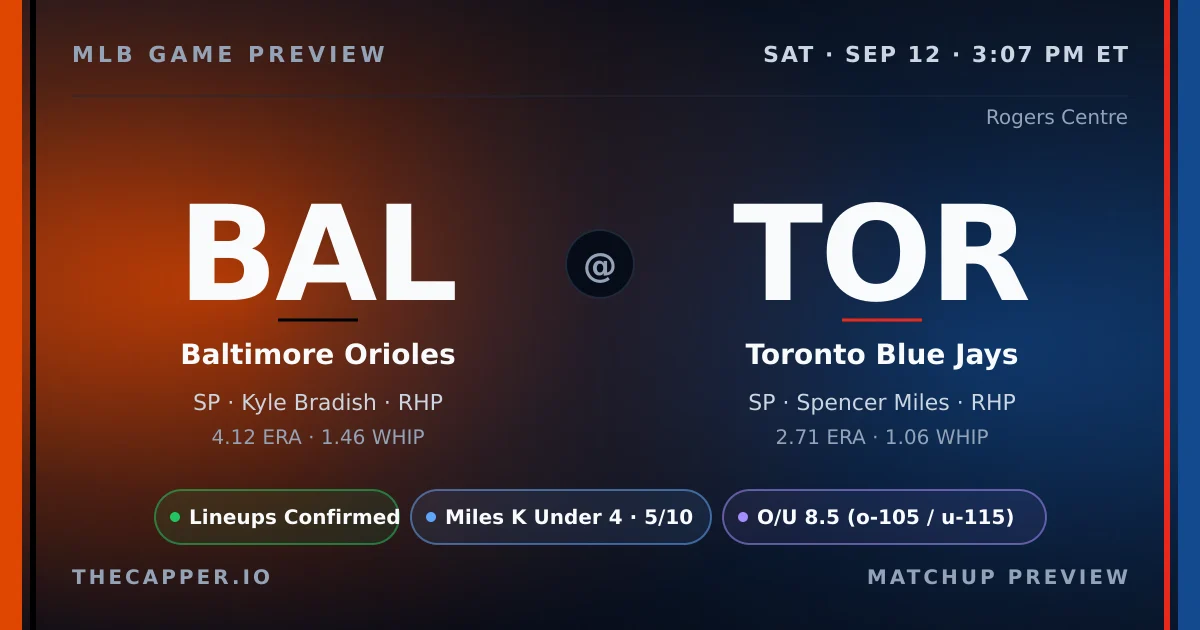
Baltimore rolls into Rogers Centre riding a two-game winning streak, while Toronto comes in the opposite direction with consecutive losses. The Orioles sit at 72-76, the Blue Jays at 73-75, and the matchup offers a narrow projected total of 5.4 runs, split 2.9 to 2.5 in favor of the visitors. Kyle Bradish takes the ball for Baltimore with a 3.91ERA, a 1.42WHIP, and 8.29 strikeouts per nine innings. Spencer Miles counters for Toronto, carrying a 2.77ERA, a 1.05WHIP, and 8.32 strikeouts per nine. Both starters live around the same strikeout rate, but Miles owns the cleaner surface numbers. Conditions at Rogers Centre are neutral: 72 degrees, no wind, and a 0.99 park factor that shaves runs rather than adds them. Recent park trends tell a different story. The last ten games at Rogers Centre have averaged 8.7 runs, with the over cashing at 50 percent and the NRFI hitting just 40 percent. That recent run environment sits well above the projected total. The real story is first-inning defense. Bradish has posted a 93 percent NRFI rate across 29 first-inning starts. Miles has an 83 percent mark over six games. Small sample on Miles, but both profiles lean clean. The NRFI model assigns a 65 percent probability and a 14.6 percent edge on no run first inning. That's the sharpest number in the matchup. The strikeout market is less compelling. Bradish projects at 3.4 strikeouts against a 3.5 line, neutral with medium-low confidence. Miles projects at 2.5 against a 4.0 line, leaning under with the same 5-out-of-10 conviction. Both bullpens are fully rested at 100 out of 100. Barrel rates favor Baltimore's bats: Jackson Holliday sits at 16.0 percent, Pete Alonso at 18.0 percent, and Gunnar Henderson at 9.1 percent. The model sees a tight game with run scoring bunched later.
NRFI model shows 65 percent probability, 14.6 percent edge
Bradish 93 percent NRFI rate, Miles 83 percent rate
Projected total 5.4 runs, recent park average 8.7
Pitching Matchup
BALAway
Kyle Bradish
RHP · 7-14 · 29 GS
ERA
4.12
WHIP
1.46
K/9
8.25
IP
155.0
Career: 3.67 ERA · 1.25 WHIP · 9.15 K/9
NRFI: 92.4%
1st Inn ERA: 0.74
TORHome
Spencer Miles
RHP · 6-2 · 7 GS
ERA
2.71
WHIP
1.06
K/9
8.63
IP
89.2
Career: 2.71 ERA · 1.06 WHIP · 8.63 K/9
On the season, Spencer Miles holds the ERA edge in this matchup. Kyle Bradish carries a 4.12ERA and 1.46WHIP, while Spencer Miles sits at 2.71ERA and 1.06WHIP. Strikeout rates: Kyle Bradish at 8.25K/9, Spencer Miles at 8.63K/9. K projections: Kyle Bradish at 3.3 (line 3.5) Spencer Miles projected at 2.4 (line 4.0). Kyle Bradish has a 92.4% career NRFI rate. No first-inning data available for Spencer Miles. Both starters throw from the R side, limiting platoon splits for either lineup.
Our strikeout model weighs pitcher K rate, opponent lineup whiff tendency, park factors, and umpire zone size to project total strikeouts per starter.
Kyle Bradish (Baltimore Orioles) is projected for 3.3 strikeouts against a posted line of 3.5. The projection is close to the line with no actionable edge. He faces a low-K lineup that strikes out at 19.3% with a 28.0% whiff rate.
Spencer Miles (Toronto Blue Jays) is projected for 2.4 strikeouts against a posted line of 4.0. The projection sits 1.6 K below the line, giving the model an Under lean. He faces a high-K lineup that strikes out at 26.1% with a 28.0% whiff rate.
The Baltimore Orioles lineup is more vulnerable to strikeouts in this matchup. Toronto Blue Jays batters K at 19.3%, Baltimore Orioles batters at 26.1%.
Our NRFI model analyzes both starting pitchers' first-inning profiles, the top-of-order hitters in each lineup, the umpire's historical zone, and environmental factors to produce a probability estimate. For this game, the model assigns a 65.0% probability of no runs in the first inning, compared to the market's implied probability of 37.7%.
That creates a strong 27.3% edge on NRFI.
The best available line is NRFI +165 / YRFI -222 at MyBookie.ag.
Home plate umpire Edwin Moscoso runs a average zone. See the umpire section below for full career data.
Our NRFI model sits at 154-136 (53.1%) on official picks this season.
Rogers Centre carries a 0.99 run factor (neutral).
Home run factor: 1.00 — the park neutral for HR power.
Park notes: Retractable roof; Turf outfield; Relatively neutral dimensions.
Roof: Retractable.
Climate controlled. Roof expected closed. Standard 72F conditions, no wind factor.
Home plate umpire: Edwin Moscoso.
Career NRFI rate: 71.4% across 7 games tracked.
Zone tendency: Slightly tight.
K factor: 1.066 (above average strikeouts in his games).
Run Projections & Total
Our projection model puts the total at 5.4 combined runs, with Baltimore Orioles projected for 2.9 and Toronto Blue Jays for 2.5.
That's 3.1 runs below the posted total of 8.5, suggesting a lean toward the Under.
The run projection favors Baltimore Orioles by 0.4 runs.
The Bottom Line
The NRFI is the clear lean. A 14.6 percent edge with 65 percent probability is the kind of separation the model likes, especially when both starters bring strong first-inning track records. Bradish's 93 percent mark over 29 starts is a large sample. Miles has just six, so there's uncertainty, but his 2.77ERA and 1.05WHIP suggest he can hold. The projected total sits more than three runs below recent Rogers Centre scoring, which introduces risk if the park reverts to form. Both bullpens are rested, so late relief won't be stretched. The strikeout lines don't offer much. Bradish is neutral, Miles leans under but with low confidence. Focus stays on the first inning.
This preview is generated from thecapper.io projection models and publicly available data. All projections are model estimates, not guarantees. Gamble responsibly. If you or someone you know has a gambling problem, call 1-800-GAMBLER.