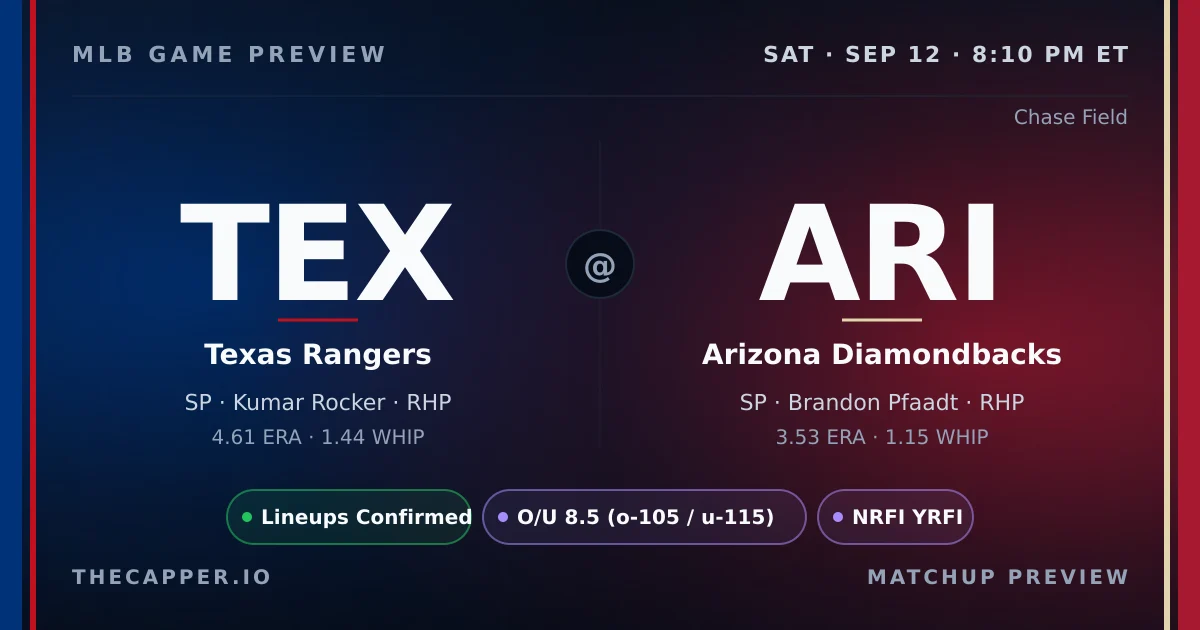
The Rangers bring a two-game losing streak into Chase Field to face a Diamondbacks club that dropped its last outing. Texas stands at 72-75, Arizona at 78-69. Kumar Rocker takes the ball for the visitors carrying a 4.61ERA, 1.44WHIP, and 8.49 strikeouts per nine innings. Brandon Pfaadt counters for the home side with a 3.53ERA, 1.15WHIP, and 5.91 K per nine. The pitching matchup tilts toward Arizona on paper, but the strikeout market offers no obvious entry. The K model projects Rocker at 3.1 strikeouts against a line of 4.0, a neutral lean at medium confidence. Pfaadt comes in at a projected 3.5 versus the same 4.0 line, also neutral with slightly lower confidence at five out of ten. Neither side screams value. Chase Field plays as a slight hitter's park with a 1.05 run factor, and recent trends have pushed scoring higher. Over the last ten games at this venue, contests have averaged 11.3 runs, with the Over cashing 62 percent of the time. The NRFI has hit just 44 percent in that stretch. First-inning context adds another wrinkle. Rocker has logged a 48 percent NRFI rate across 25 first-inning outings, while Pfaadt sits at 78 percent over 18 games. That gap is wide, and it matters in a park environment that has been leaking runs early. Both bullpens enter fresh, fatigue registering at zero on the hundred-point scale. Weather is neutral: 72 degrees, no wind. The Rangers and Diamondbacks present a contrast in form and baseline skill, but the betting surface is flat. No strikeout edge, no total edge surfaced in the summary. The NRFI split between the two starters is the sharpest angle on the board.
On the season, Brandon Pfaadt holds the ERA edge in this matchup. Kumar Rocker carries a 4.61ERA and 1.44WHIP, while Brandon Pfaadt sits at 3.53ERA and 1.15WHIP. Strikeout rates: Kumar Rocker at 8.49K/9, Brandon Pfaadt at 5.91K/9. K projections: Kumar Rocker at 3.2 (line 3.5) Brandon Pfaadt projected at 3.6 (line 4.5). First-inning scoring: Kumar Rocker holds a 51.8% career NRFI rate, Brandon Pfaadt at 73.3%. Combined average: 62.6%. Both starters throw from the R side, limiting platoon splits for either lineup.
Our strikeout model weighs pitcher K rate, opponent lineup whiff tendency, park factors, and umpire zone size to project total strikeouts per starter.
Kumar Rocker (Texas Rangers) is projected for 3.2 strikeouts against a posted line of 3.5. The projection is close to the line with no actionable edge. He faces a moderate-K lineup that strikes out at 23.8% with a 28.0% whiff rate.
Brandon Pfaadt (Arizona Diamondbacks) is projected for 3.6 strikeouts against a posted line of 4.5. The projection is close to the line with no actionable edge. He faces a high-K lineup that strikes out at 24.6% with a 28.0% whiff rate.
The Texas Rangers lineup is more vulnerable to strikeouts in this matchup. Arizona Diamondbacks batters K at 23.8%, Texas Rangers batters at 24.6%.
Our NRFI model analyzes both starting pitchers' first-inning profiles, the top-of-order hitters in each lineup, the umpire's historical zone, and environmental factors to produce a probability estimate. For this game, the model assigns a 42.5% probability of no runs in the first inning, compared to the market's implied probability of 51.2%.
That creates a slim -8.8% edge on YRFI.
The best available line is NRFI -105 / YRFI -115 at FanDuel.
Home plate umpire Chad Fairchild runs a tight zone. See the umpire section below for full career data.
Our NRFI model sits at 154-136 (53.1%) on official picks this season.
Home run factor: 1.09 — the park elevates HR power.
Park notes: High desert elevation (1100ft); Retractable roof; Hot climate.
Roof: Retractable.
Climate controlled. Roof expected closed. Standard 72F conditions, no wind factor.
Home plate umpire: Chad Fairchild.
Career NRFI rate: 57.1% across 7 games tracked.
Zone tendency: Slightly tight.
K factor: 0.725 (below average strikeouts in his games).
Run Projections & Total
Our projection model puts the total at 5.5 combined runs, with Texas Rangers projected for 2.8 and Arizona Diamondbacks for 2.8.
That's 3.0 runs below the posted total of 8.5, suggesting a lean toward the Under.
The run projection is essentially a coin flip between these two teams.
The Bottom Line
The strikeout projections offer no edge with both Rocker and Pfaadt sitting well below their 4.0 lines and marked neutral by the model. The NRFI carries the clearest signal. Pfaadt's 78 percent first-inning success rate towers over Rocker's 48 percent mark, a thirty-point gap that matters in a park environment averaging more than eleven runs per contest over the last ten. Chase Field has seen the NRFI miss 56 percent of the time in that span, and pairing that trend with Rocker's leaky first inning creates a plausible fade opportunity on the full-game NRFI if the price is right. Both bullpens are rested, so late-inning leverage is not a concern. The model does not surface a total or moneyline edge here. Focus belongs on the first-inning mismatch.
This preview is generated from thecapper.io projection models and publicly available data. All projections are model estimates, not guarantees. Gamble responsibly. If you or someone you know has a gambling problem, call 1-800-GAMBLER.