Beta Free full access during beta. All models, tools, and daily picks included.
Early Preview Lineups: Confirmed Odds Posted 7 min read

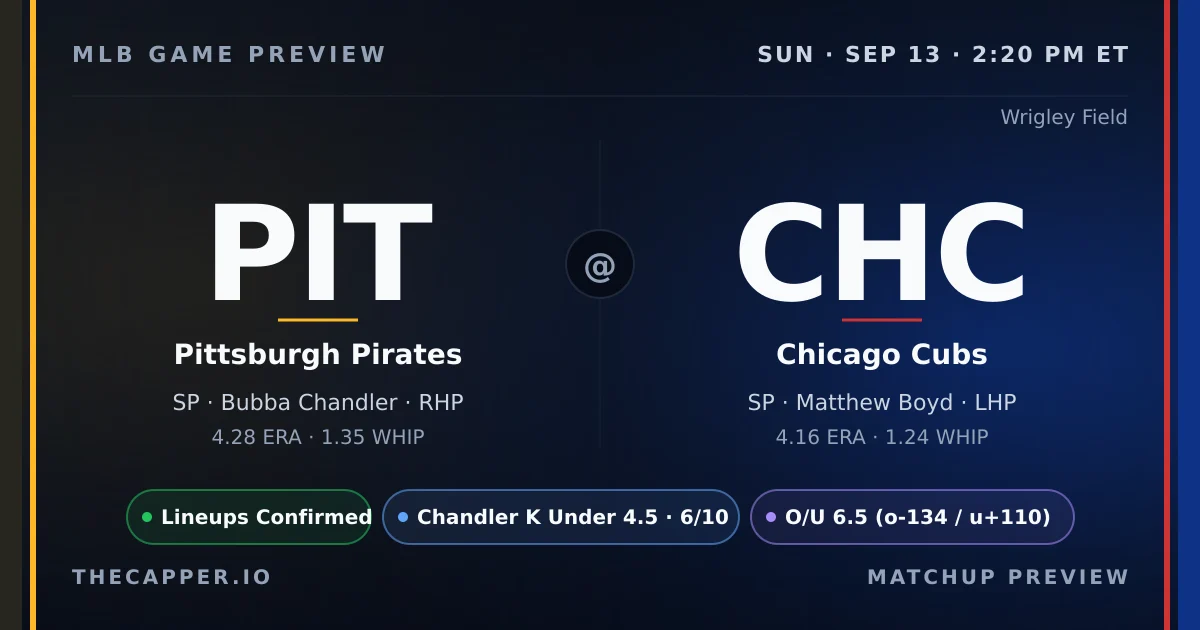
Pittsburgh Pirates vs Chicago Cubs Preview

PIT at CHC 2026-09-13 preview: probable pitchers, projected lineups, NRFI/F5 model picks, weather, ballpark, and umpire context.

Pittsburgh Pirates at Chicago Cubs MLB game preview for September 13, 2026
PIT
Pittsburgh Pirates
Bubba Chandler RHP
@
2:20 PM ET
Wrigley Field
CHC
Chicago Cubs
Matthew Boyd LHP
Last updated Sunday, September 13, 2026
Final This game has finished. Read the recap for final score, model grades, and box score.

Key Facts

Matchup
Pittsburgh Pirates at Chicago Cubs
Date
Sunday, September 13, 2026
First Pitch
2:20 PM ET
Venue
Wrigley Field
Probable Starters
Bubba Chandler (RHP) vs Matthew Boyd (LHP)
Lineups
Confirmed
Odds Snapshot
Sep 13, 2:21 PM ET
Last Updated
Sep 13, 7:27 AM ET

Betting Board

Snapshot Sep 13, 2:21 PM ET
Moneyline
PIT +139
CHC -148
Total
Over 6.5 -134
Under 6.5 +110
Run Line
PIT +1.5 -172
CHC -1.5 +142

Model Angles

NRFI Model
NRFI · 59%
+2.0% edge · playable
Projected Total
5.4
model combined runs
Park Factor
1.05
Neutral · HR 1.09
First Pitch Weather
69°F
11.5 mph NNE
The Pirates and Cubs meet at Wrigley Field on a mild September afternoon, and the most compelling angle sits in the first inning. The NRFI model projects a 58 percent probability with a 5.5 percent edge, anchored by two starting pitchers who have kept opponents off the board early all season. Bubba Chandler owns a 75 percent NRFI rate across 28 first-inning samples, while Matthew Boyd has been even sharper at 79 percent in 19 games. Those marks provide a solid foundation when the model already leans toward a scoreless opening frame. Chandler brings a 4.25 ERA and 1.34 WHIP to the North Side. His 8.18 strikeouts per nine show he can miss bats, though the K model projects just 3.3 punchouts today against a 4.5 line. That's a medium-confidence lean to the under. Boyd counters with a 4.03 ERA, a tighter 1.22 WHIP, and 7.08 strikeouts per nine. His K projection also sits at 3.3, well beneath the posted 5.5. Confidence there is lower, but both strikeout totals point the same direction. The projected game total lands at 5.4 runs, with Pittsburgh contributing 2.7 and Chicago 2.8. Wrigley's 1.05 park factor nudges offense slightly, and park trends over the last ten games show an average of 8.4 runs per contest. Over and under have split evenly at 50 percent in that span, while the NRFI has cashed at an 80 percent clip. Weather is neutral: 71 degrees with an 11 mph wind out of the north-northeast. Pittsburgh enters at 74-75 on a two-game losing streak. Chicago sits at 83-66 and has won two straight. Bullpen fatigue registers at 50 out of 100 for the Pirates, with Khristian Curtis unavailable. The Cubs check in at 52 out of 100. Barrel-rate leaders include Oneil Cruz at 23.3 percent, Konnor Griffin at 16.7 percent, and Bryan Reynolds at 9.1 percent.
  • NRFI model shows 58% probability with 5.5% edge
  • Chandler 75% NRFI rate, Boyd 79% in first inning
  • Both K projections sit below posted lines today

Pitching Matchup

PIT Away
Bubba Chandler
RHP · 8-9 · 28 GS
ERA
4.28
WHIP
1.35
K/9
8.06
IP
147.1
Career: 4.23 ERA · 1.28 WHIP · 8.21 K/9
NRFI: 75.0%
1st Inn ERA: 4.18
CHC Home
Matthew Boyd
LHP · 8-5 · 20 GS
ERA
4.16
WHIP
1.24
K/9
6.99
IP
114.2
Career: 4.53 ERA · 1.27 WHIP · 8.49 K/9
NRFI: 78.4%
1st Inn ERA: 4.09

On the season, Matthew Boyd holds the ERA edge in this matchup. Bubba Chandler carries a 4.28 ERA and 1.35 WHIP, while Matthew Boyd sits at 4.16 ERA and 1.24 WHIP.
Strikeout rates: Bubba Chandler at 8.06 K/9, Matthew Boyd at 6.99 K/9.
K projections: Bubba Chandler at 3.3 (line 4.5)
Matthew Boyd projected at 3.3 (line 5.5).
First-inning scoring: Bubba Chandler holds a 75.0% career NRFI rate, Matthew Boyd at 78.4%. Combined average: 76.7%.
This is a RHP vs LHP matchup, creating potential platoon advantages in both lineups.

Strikeout Projections

Bubba Chandler vs CHC
Proj: 3.3Line: 4.5
-1.2
Confidence:
Matthew Boyd vs PIT
Proj: 3.3Line: 5.5
-2.2
Confidence:
View all K projections on SlateIQ

Our strikeout model weighs pitcher K rate, opponent lineup whiff tendency, park factors, and umpire zone size to project total strikeouts per starter.

Bubba Chandler (Pittsburgh Pirates) is projected for 3.3 strikeouts against a posted line of 4.5. The projection sits 1.2 K below the line, giving the model an Under lean.
He faces a moderate-K lineup that strikes out at 22.7% with a 28.0% whiff rate.

Matthew Boyd (Chicago Cubs) is projected for 3.3 strikeouts against a posted line of 5.5. The projection sits 2.2 K below the line, giving the model an Under lean.
He faces a high-K lineup that strikes out at 25.3% with a 28.0% whiff rate.

The Pittsburgh Pirates lineup is more vulnerable to strikeouts in this matchup. Chicago Cubs batters K at 22.7%, Pittsburgh Pirates batters at 25.3%.

NRFI & First 5 Analysis

NRFI Model
59.3%
probability of NRFI
+2.0%
market edge
Signal
Market implied: 57.3%Model: 59.3%
First 5 Innings
3.0est. F5 runs
PIT
4.28 ERA
5.3 inn/start
CHC
4.16 ERA
5.7 inn/start
F5 lean: Even matchup
PIT K Projection
Bubba Chandler
3.3proj
Line: 4.5
-1.2 UNDER
Confidence
CHC K Projection
Matthew Boyd
3.3proj
Line: 5.5
-2.2 UNDER
Confidence
Explore all model projections

Our NRFI model analyzes both starting pitchers' first-inning profiles, the top-of-order hitters in each lineup, the umpire's historical zone, and environmental factors to produce a probability estimate. For this game, the model assigns a 59.3% probability of no runs in the first inning, compared to the market's implied probability of 57.3%.

  • That creates a slim 2.0% edge on NRFI.
  • The best available line is NRFI -134 / YRFI +110 at FanDuel.
  • This qualifies as a playable in our publication system.
  • Home plate umpire Ryan Wills runs a wide zone. See the umpire section below for full career data.
  • Our NRFI model sits at 154-138 (52.7%) on official picks this season.

Prop Edges

3 model signals detected
Hits
69.9%
Bubba Chandler
Strikeouts Under 4.5
Matthew Boyd
Strikeouts Under 5.5
See all today's picks and edges

Lineup & Matchup Breakdown

Pittsburgh Pirates Confirmed
K%: 25.3
1Konnor GriffinRSS
2Oneil CruzLCF
Whiff rate: 28.0%Team page
Chicago Cubs Confirmed
K%: 22.7
2Seiya SuzukiRRF
Whiff rate: 28.0%Team page
Batter vs Pitcher matchup tool

Lineups are confirmed as of this writing.

Pittsburgh Pirates K vulnerability: 25.3% strikeout rate, 28.0% whiff rate.

Chicago Cubs K vulnerability: 22.7% strikeout rate, 28.0% whiff rate.

Ballpark, Weather & Umpire

Wrigley Field
Run Factor1.05
HR Factor1.09
Full park profile
Home Plate Umpire
Ryan Wills
Wide NRFI: 50.0% 6 games
Full umpire profile
Hourly Game Forecast
69°
2 PM
12 mph
NNE
68°
3 PM
9 mph
NNE
65°
4 PM
6 mph
N
66°
5 PM
6 mph
N
  • Wrigley Field carries a 1.05 run factor (neutral).
  • Home run factor: 1.09 — the park elevates HR power.
  • Park notes: Ivy-covered left field wall; Wind factor from Lake Michigan; High wall in left (11.5ft).
  • First pitch forecast: 69F with 12 mph winds from the NNE. Humidity: 65%.
  • Temperature drops from 69F at first pitch to 66F by the late innings.
  • Wind advisory: 12 mph winds from the NNE may impact fly balls.
  • Home plate umpire: Ryan Wills.
  • Career NRFI rate: 50.0% across 6 games tracked.
  • Zone tendency: Wide.
  • K factor: 1.164 (above average strikeouts in his games).

Run Projections & Total

  • Our projection model puts the total at 5.4 combined runs, with Pittsburgh Pirates projected for 2.7 and Chicago Cubs for 2.8.
  • That's 1.1 runs below the posted total of 6.5, suggesting a lean toward the Under.
  • The run projection is essentially a coin flip between these two teams.
The Bottom Line
The NRFI offers the sharpest edge in this matchup. Chandler and Boyd have combined for a 77 percent first-inning shutout rate in their respective samples, and the model assigns a 58 percent probability with a 5.5 percent edge. Wrigley has gone scoreless in the first eight times over the last ten games, reinforcing the trend. The strikeout unders carry weaker confidence but align with projections well beneath the posted totals. Both starters have shown the ability to miss bats, yet the K model sees regression today. The game total and side offer narrower margins. Focus on the NRFI, where the data and recent park trends converge.
This preview is generated from thecapper.io projection models and publicly available data. All projections are model estimates, not guarantees. Gamble responsibly. If you or someone you know has a gambling problem, call 1-800-GAMBLER.