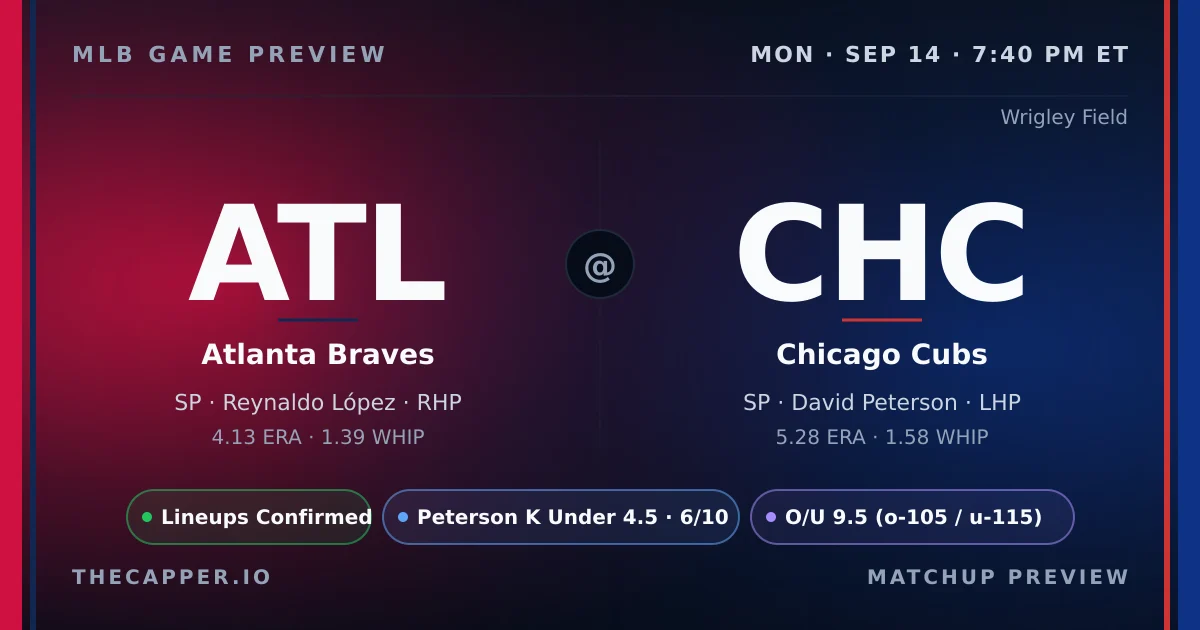
Atlanta brings an 88-62 record into Wrigley Field on Thursday night, while Chicago sits at 83-67. Both clubs enter on a loss. Reynaldo López gets the ball for the Braves. The right-hander carries a 4.13ERA and 1.39WHIP, striking out 8.37 per nine. David Peterson counters for the Cubs with a 5.28ERA and 1.58WHIP, fanning 8.02 per nine. Neither line inspires confidence, and the projected total reflects that uncertainty at 5.6 runs, split evenly at 2.8 per side. Wrigley carries a 1.05 park factor. Seventy-degree air and a twelve-mile-per-hour wind from the southeast set the scene at 7:40 PM ET. The strikeout market has López posted at 4.5 and the model projects 3.7. Lean is neutral with confidence at five out of ten. Peterson also sits at 4.5, but the projection is 3.5, so the lean tilts under with six-out-of-ten confidence. Neither pitcher profiles as a K-stuffing play, and the under on Peterson makes more sense than any other K angle in this matchup. The NRFI sits at forty-four percent probability with a negative 7.2 percent edge on the YRFI, so the first-inning run line doesn't offer value. López has logged a forty-seven percent NRFI rate across fifteen first-inning samples. Peterson checks in at forty-five percent over twenty-two first-inning games. Wrigley has gone NRFI in eighty percent of its last ten games, a stark contrast to the model output and a reminder that small samples swing fast. Park trends over the last ten at Wrigley average 8.4 runs per game, with the over cashing fifty percent of the time. Atlanta's bullpen is rested at one hundred out of one hundred fatigue. Chicago's pen sits at eighty-four with Aaron Civale unavailable. Barrel threats include Drake Baldwin at 16.7 percent, Ronald Acuña Jr. at 16.1 percent, and Matt Olson at 18.5 percent.
Projected total is 5.6 runs, evenly split at 2.8 per side
Peterson K projection 3.5 versus 4.5 line, under lean confidence 6/10
NRFI at 44% probability with negative 7.2% edge on YRFI
Pitching Matchup
ATLAway
Reynaldo López
RHP · 4-4 · 12 GS
ERA
4.13
WHIP
1.39
K/9
8.37
IP
76.1
Career: 3.95 ERA · 1.28 WHIP · 8.40 K/9
NRFI: 56.5%
1st Inn ERA: 6.22
CHCHome
David Peterson
LHP · 7-8 · 20 GS
ERA
5.28
WHIP
1.58
K/9
8.02
IP
131.1
Career: 4.32 ERA · 1.41 WHIP · 8.73 K/9
NRFI: 64.3%
1st Inn ERA: 5.22
On the season, Reynaldo López holds the ERA edge in this matchup. Reynaldo López carries a 4.13ERA and 1.39WHIP, while David Peterson sits at 5.28ERA and 1.58WHIP. Strikeout rates: Reynaldo López at 8.37K/9, David Peterson at 8.02K/9. K projections: Reynaldo López at 3.7 (line 4.5) David Peterson projected at 3.5 (line 4.5). First-inning scoring: Reynaldo López holds a 56.5% career NRFI rate, David Peterson at 64.2%. Combined average: 60.4%. This is a RHP vs LHP matchup, creating potential platoon advantages in both lineups.
Our strikeout model weighs pitcher K rate, opponent lineup whiff tendency, park factors, and umpire zone size to project total strikeouts per starter.
Reynaldo López (Atlanta Braves) is projected for 3.7 strikeouts against a posted line of 4.5. The projection is close to the line with no actionable edge. He faces a moderate-K lineup that strikes out at 23.2% with a 28.0% whiff rate.
David Peterson (Chicago Cubs) is projected for 3.5 strikeouts against a posted line of 4.5. The projection sits 1.0 K below the line, giving the model an Under lean. He faces a moderate-K lineup that strikes out at 23.3% with a 28.0% whiff rate.
The Atlanta Braves lineup is more vulnerable to strikeouts in this matchup. Chicago Cubs batters K at 23.2%, Atlanta Braves batters at 23.3%.
Our NRFI model analyzes both starting pitchers' first-inning profiles, the top-of-order hitters in each lineup, the umpire's historical zone, and environmental factors to produce a probability estimate. For this game, the model assigns a 44.6% probability of no runs in the first inning, compared to the market's implied probability of 52.4%.
That creates a slim -7.8% edge on YRFI.
The best available line is NRFI -110 / YRFI -110 at FanDuel.
Home plate umpire Paul Clemons runs a wide zone. See the umpire section below for full career data.
Our NRFI model sits at 155-143 (52.0%) on official picks this season.
Wrigley Field carries a 1.05 run factor (neutral).
Home run factor: 1.09 — the park elevates HR power.
Park notes: Ivy-covered left field wall; Wind factor from Lake Michigan; High wall in left (11.5ft).
First pitch forecast: 69F with 12 mph winds from the SE. Humidity: 47%.
Wind advisory: 12 mph winds from the SE may impact fly balls.
Home plate umpire: Paul Clemons.
Career NRFI rate: 33.3% across 6 games tracked.
Zone tendency: Wide.
K factor: 0.885 (below average strikeouts in his games).
Run Projections & Total
Our projection model puts the total at 5.6 combined runs, with Atlanta Braves projected for 2.8 and Chicago Cubs for 2.8.
That's 3.9 runs below the posted total of 9.5, suggesting a lean toward the Under.
The run projection is essentially a coin flip between these two teams.
The Bottom Line
The Peterson strikeout under at 4.5 carries the cleanest edge in this matchup, with the model projecting 3.5 and confidence at six out of ten. López sits neutral at 4.5 versus a 3.7 projection, so there's no reason to force that side. The NRFI edge is negative, and the eighty-percent Wrigley trend over ten games conflicts with both starter histories and the model probability of forty-four percent. Skip the first-inning run line. The total projection of 5.6 is tepid, and neither bullpen fatigue nor the 1.05 park factor moves the needle dramatically. Focus on the Peterson strikeout under if anything.
This preview is generated from thecapper.io projection models and publicly available data. All projections are model estimates, not guarantees. Gamble responsibly. If you or someone you know has a gambling problem, call 1-800-GAMBLER.