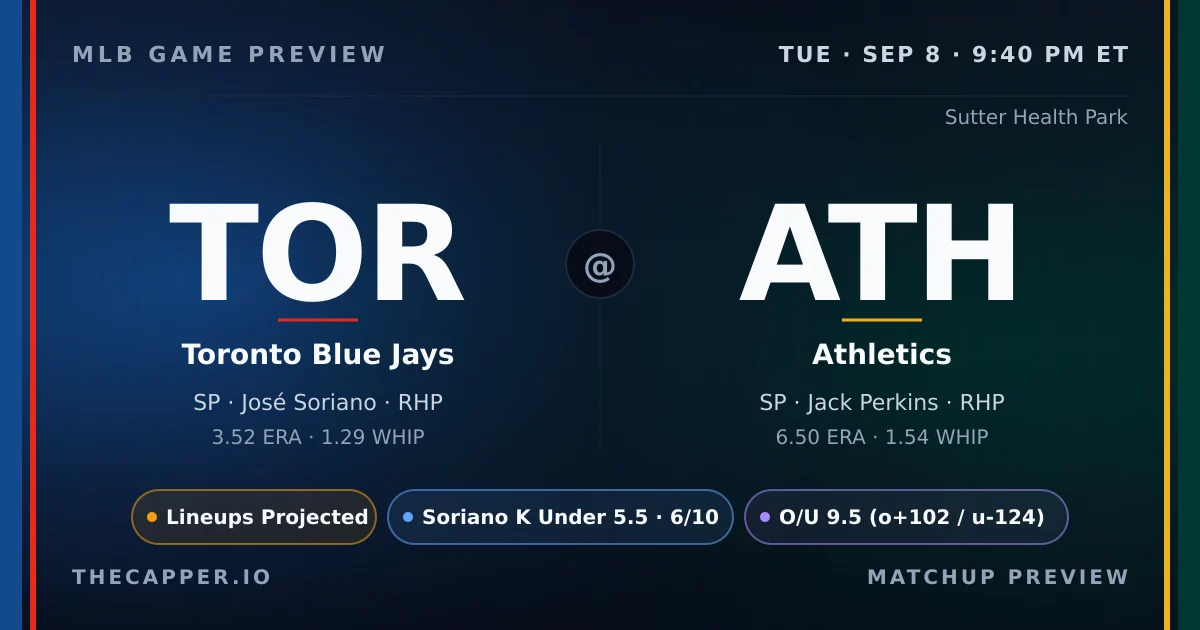
The Blue Jays bring a 72-73 record and a two-game losing streak into Sutter Health Park on Friday night, looking to halt the slide behind José Soriano. The right-hander carries a 3.52ERA and 1.29WHIP into Sacramento, numbers that stand in sharp contrast to the Athletics' starter on the opposite side. Jack Perkins owns a 6.50ERA and 1.54WHIP through his time on the bump this season, and the gap in run prevention forms the spine of this matchup. Soriano strikes out 8.71 per nine. Perkins fans 10.62 per nine despite the inflated ratios. The K model projects Soriano at 3.5 strikeouts against a 4.0 line, landing neutral with medium confidence. Perkins slots in at 4.0 projected against a 3.5 line, also neutral but with slightly lower confidence at five out of ten. Neither K prop offers a clean angle tonight. The NRFI sits at 54 percent probability with a 0.8 percent edge on no run first inning, a modest tilt but not enough to move the needle in a meaningful way. Soriano carries an 80 percent NRFI rate across 30 first-inning appearances. Perkins posts a 50 percent mark over 14 games. That split is significant. The projected total checks in at 2.5 runs, all of them on the Toronto side of the ledger. The model assigns zero runs to the Athletics, a stark forecast that speaks to the pitching mismatch and the offensive context. Vladimir Guerrero Jr. brings a 15.4 percent barrel rate to the plate, the highest among key matchups listed. Kazuma Okamoto sits at 13.9 percent. Alejandro Kirk logs 9.1 percent. Toronto's bullpen shows full fatigue at 100 out of 100. The Athletics' relief corps registers 53 out of 100, a fresher unit if the game reaches the middle innings.
Soriano's 3.52ERA faces Perkins' 6.50 in run prevention gap
NRFI model shows 54 percent probability, 0.8 percent edge
Toronto bullpen fatigue at 100, Athletics at 53
Pitching Matchup
TORAway
José Soriano
RHP · 11-7 · 28 GS
ERA
3.52
WHIP
1.29
K/9
8.71
IP
156.0
Career: 3.77 ERA · 1.31 WHIP · 8.55 K/9
NRFI: 76.7%
1st Inn ERA: 3.03
ATHHome
Jack Perkins
RHP · 3-10 · 13 GS
ERA
6.50
WHIP
1.54
K/9
10.62
IP
98.1
Career: 5.85 ERA · 1.43 WHIP · 10.05 K/9
On the season, José Soriano holds the ERA edge in this matchup. José Soriano carries a 3.52ERA and 1.29WHIP, while Jack Perkins sits at 6.50ERA and 1.54WHIP. Strikeout rates: José Soriano at 8.71K/9, Jack Perkins at 10.62K/9. K projections: José Soriano at 3.5 (line 5.5) Jack Perkins projected at 4.0 (line 3.5). José Soriano has a 76.7% career NRFI rate. No first-inning data available for Jack Perkins. Both starters throw from the R side, limiting platoon splits for either lineup.
Our strikeout model weighs pitcher K rate, opponent lineup whiff tendency, park factors, and umpire zone size to project total strikeouts per starter.
José Soriano (Toronto Blue Jays) is projected for 3.5 strikeouts against a posted line of 5.5. The projection sits 2.0 K below the line, giving the model an Under lean. He faces a moderate-K lineup that strikes out at 22.8% with a 28.0% whiff rate.
Jack Perkins (Athletics) is projected for 4.0 strikeouts against a posted line of 3.5. The projection is close to the line with no actionable edge.
He faces a moderate-K lineup that strikes out at 20.4% with a 28.0% whiff rate.
The Athletics lineup is more vulnerable to strikeouts in this matchup. Athletics batters K at 22.8%, Toronto Blue Jays batters at 20.4%.
Our NRFI model analyzes both starting pitchers' first-inning profiles, the top-of-order hitters in each lineup, the umpire's historical zone, and environmental factors to produce a probability estimate. For this game, the model assigns a 54.6% probability of no runs in the first inning, compared to the market's implied probability of 49.5%.
That creates a moderate 5.1% edge on NRFI.
The best available line is NRFI +102 / YRFI -124 at FanDuel.
Home plate umpire Bill Miller runs a wide zone. See the umpire section below for full career data.
Our NRFI model sits at 148-132 (52.9%) on official picks this season.
Park factor data not available for Sutter Health Park.
Weather forecast not available for this game.
Home plate umpire: Bill Miller.
Career NRFI rate: 55.6% across 9 games tracked.
Zone tendency: Wide.
K factor: 1.227 (above average strikeouts in his games).
Run Projections & Total
Our projection model puts the total at 2.5 combined runs, with Toronto Blue Jays projected for 2.5 and Athletics for 0.0.
That's 7.0 runs below the posted total of 9.5, suggesting a lean toward the Under.
The run projection favors Toronto Blue Jays by 2.5 runs.
The Bottom Line
The pitching matchup tilts heavily toward Toronto. Soriano's 3.52ERA and 1.29WHIP dwarf Perkins' 6.50 and 1.54, and the projected total of 2.5 runs reflects that imbalance. The NRFI carries a 54 percent probability with less than one percent edge, not a compelling play given the vig. Soriano's 80 percent first-inning rate over 30 games is strong, but Perkins' 50 percent mark over a smaller sample adds variance. Neither K prop offers value; both land neutral with the model. The bullpen fatigue split is stark, Toronto at full tilt and Oakland at half, but in a game scripted for early offense the late-inning depth may not matter. Focus on the run-line and total if you play this one.
This preview is generated from thecapper.io projection models and publicly available data. All projections are model estimates, not guarantees. Gamble responsibly. If you or someone you know has a gambling problem, call 1-800-GAMBLER.