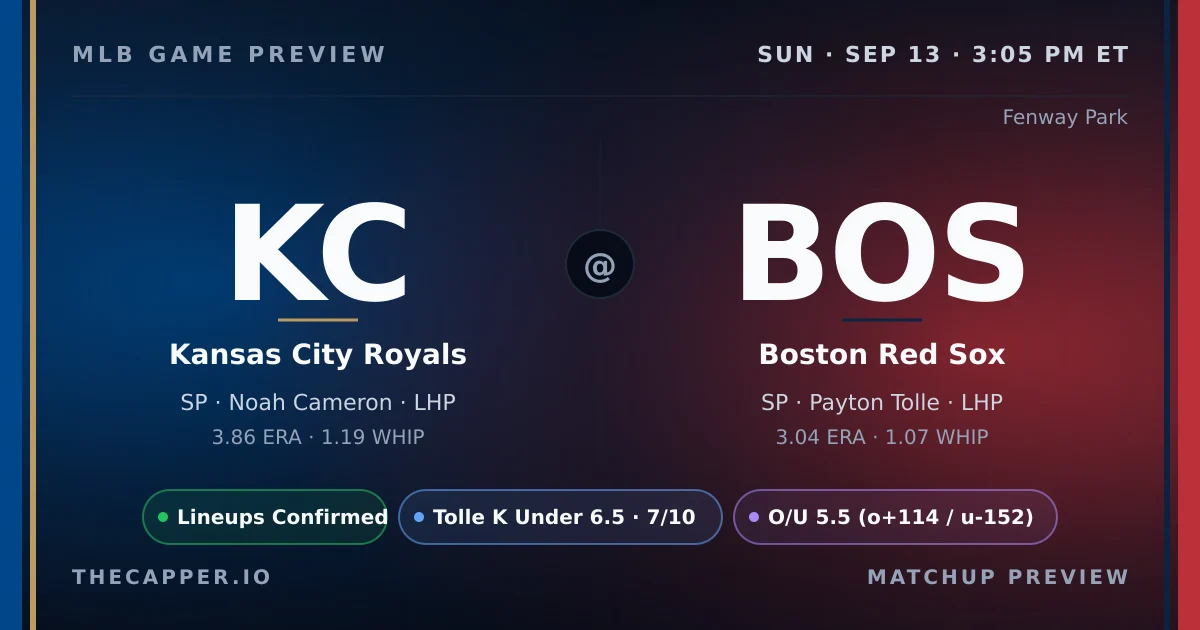
Boston wraps a three-game set against Kansas City at Fenway Park this afternoon with both clubs sending left-handers to the mound. The Red Sox enter 81-68 following a win yesterday, while the Royals sit at 66-83 after dropping their last outing. Payton Tolle takes the ball for the home side with a 3.15ERA, 1.08WHIP, and 10.45 strikeouts per nine innings. Noah Cameron counters for Kansas City at 3.93, 1.20, and 8.14. The projected total sits at 5.4 runs, split evenly at 2.7 per side, and Fenway's park factor clocks in at 1.08. The matchup offers edges in multiple markets, starting with strikeouts. Cameron's projection lands at 3.8 against a 5.5 line, a lean toward the under with medium-low confidence. Tolle's model output hits 4.7 against a 6.5 posted number, a sharper under lean backed by higher confidence at eight out of ten. That two-strikeout gap between projection and line is the clearest separation on the card. The NRFI shows value as well. The model puts scoreless-first probability at 53 percent with a 2.7 percent edge on no runs in the first. Both starters carry strong first-inning résumés. Cameron has held opponents scoreless in 72 percent of his 29 first-inning appearances, while Tolle has done the same in 70 percent of his 23 starts. Recent park trends at Fenway tilt the same way, with NRFI cashing in six of the last ten games. The over has hit just twice in that stretch, and the ten-game run-scoring average sits at 6.0. Boston's bullpen enters at 58 percent fatigue; Kansas City's is fully rested at 100 out of 100. On the Kansas City side, Bobby Witt Jr. posts a 10.5 percent barrel rate, Vinnie Pasquantino sits at 15.6 percent, and Salvador Perez checks in at 15.4 percent. Weather calls for 68 degrees with a 6-mph wind out of the east-northeast.
Tolle projected at 4.7 strikeouts vs 6.5 line
NRFI model shows 53% probability, 2.7% edge
Cameron 72% NRFI rate, Tolle 70% across combined 52 starts
Pitching Matchup
KCAway
Noah Cameron
LHP · 9-8 · 28 GS
ERA
3.86
WHIP
1.19
K/9
8.11
IP
165.1
Career: 3.47 ERA · 1.15 WHIP · 7.79 K/9
NRFI: 72.3%
1st Inn ERA: 3.66
BOSHome
Payton Tolle
LHP · 9-6 · 25 GS
ERA
3.04
WHIP
1.07
K/9
10.39
IP
142.0
Career: 3.35 ERA · 1.12 WHIP · 10.40 K/9
NRFI: 69.6%
1st Inn ERA: 3.13
On the season, Payton Tolle holds the ERA edge in this matchup. Noah Cameron carries a 3.86ERA and 1.19WHIP, while Payton Tolle sits at 3.04ERA and 1.07WHIP. Strikeout rates: Noah Cameron at 8.11K/9, Payton Tolle at 10.39K/9. K projections: Noah Cameron at 3.9 (line 4.5) Payton Tolle projected at 5.0 (line 6.5). First-inning scoring: Noah Cameron holds a 72.3% career NRFI rate, Payton Tolle at 69.6%. Combined average: 70.9%. Both starters throw from the L side, limiting platoon splits for either lineup.
Our strikeout model weighs pitcher K rate, opponent lineup whiff tendency, park factors, and umpire zone size to project total strikeouts per starter.
Noah Cameron (Kansas City Royals) is projected for 3.9 strikeouts against a posted line of 4.5. The projection is close to the line with no actionable edge. He faces a high-K lineup that strikes out at 25.1% with a 28.0% whiff rate.
Payton Tolle (Boston Red Sox) is projected for 5.0 strikeouts against a posted line of 6.5. The projection sits 1.5 K below the line, giving the model an Under lean. He faces a moderate-K lineup that strikes out at 23.7% with a 28.0% whiff rate.
The Boston Red Sox lineup is more vulnerable to strikeouts in this matchup. Boston Red Sox batters K at 25.1%, Kansas City Royals batters at 23.7%.
Our NRFI model analyzes both starting pitchers' first-inning profiles, the top-of-order hitters in each lineup, the umpire's historical zone, and environmental factors to produce a probability estimate. For this game, the model assigns a 53.5% probability of no runs in the first inning, compared to the market's implied probability of 59.7%.
That creates a slim -6.2% edge on YRFI.
The best available line is NRFI -148 / YRFI +112 at FanDuel.
Home plate umpire Roberto Ortiz runs a wide zone. See the umpire section below for full career data.
Our NRFI model sits at 154-138 (52.7%) on official picks this season.
Fenway Park carries a 1.08 run factor (hitter-friendly).
Home run factor: 1.15 — the park elevates HR power.
Park notes: Green Monster (37ft wall in left field); Pesky's Pole (302ft in right field); Triangle in center field.
First pitch forecast: 67F with 5 mph winds from the N. Humidity: 98%.
Home plate umpire: Roberto Ortiz.
Career NRFI rate: 28.6% across 7 games tracked.
Zone tendency: Average.
K factor: 1.023 (above average strikeouts in his games).
Run Projections & Total
Our projection model puts the total at 5.4 combined runs, with Kansas City Royals projected for 2.7 and Boston Red Sox for 2.7.
The posted total sits at 5.5, which aligns closely with our projection. No clear total lean.
The run projection is essentially a coin flip between these two teams.
The Bottom Line
The clearest edge sits on Tolle's strikeout under. A two-strikeout cushion between the 4.7 projection and the 6.5 line, combined with eight-out-of-ten confidence, points to the sharper side of the market. The NRFI carries a smaller edge at 2.7 percent, but both pitchers bring first-inning track records north of 70 percent and recent Fenway trends support the scoreless open. Cameron's strikeout under offers a wider projection-to-line gap than Tolle's, though confidence drops to six out of ten. The projected total and the recent ten-game Fenway average align within half a run, leaving the full-game run line without much separation. Focus remains on the strikeout unders and the NRFI, where the model and the matchup history converge.
This preview is generated from thecapper.io projection models and publicly available data. All projections are model estimates, not guarantees. Gamble responsibly. If you or someone you know has a gambling problem, call 1-800-GAMBLER.