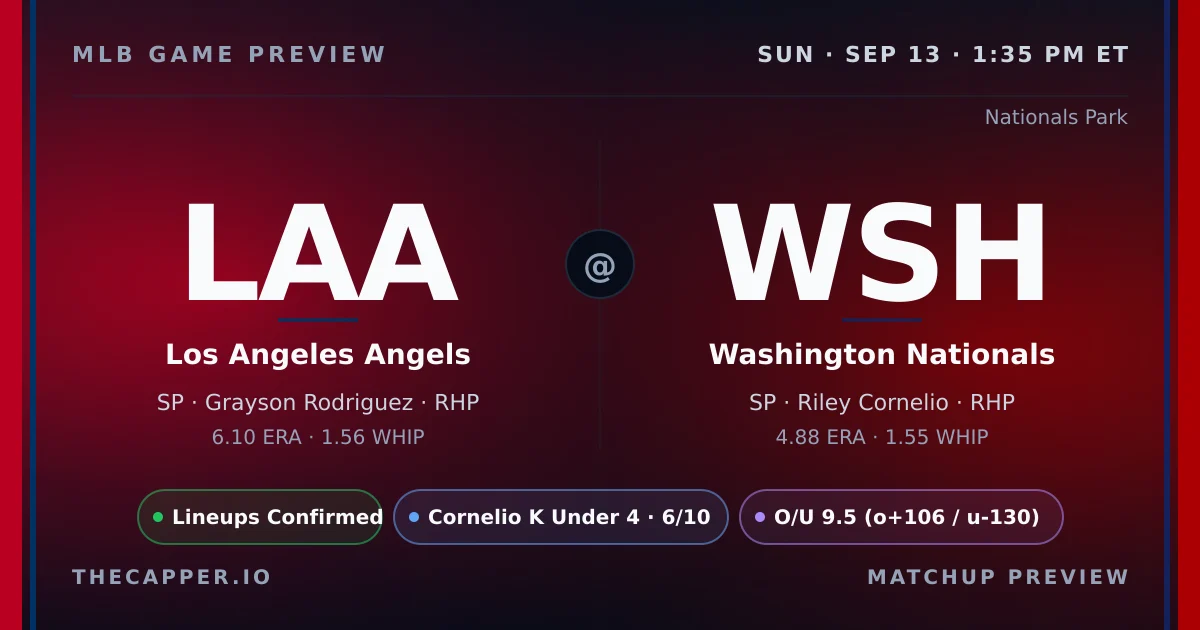
The Angels arrive in Washington on a two-game losing streak, facing a Nationals club that has won two straight. Los Angeles brings a 56-92 record into Nationals Park, while Washington sits at 69-81 with a chance to build momentum in the final stretch. The pitching matchup offers little in the way of run prevention. Grayson Rodriguez takes the ball for the Angels with a 6.28ERA and 1.57WHIP, striking out 8.27 per nine. Jake Irvin counters for the Nationals with a 5.52ERA and 1.42WHIP, logging 8.87 strikeouts per nine. Both lines are elevated, and both staffs enter with identical bullpen fatigue ratings of 87 out of 100. The environment at Nationals Park tilts neutral on paper. The park factor sits at 0.99 runs, meaning no inherent edge for offense or pitching. Recent trends tell a different story. Over the last 10 games at this venue, contests have averaged 9.9 runs, with the over cashing 50 percent of the time. The NRFI has hit just 30 percent in that same window, a red flag for first-inning bettors. Weather sits mild: 83 degrees with a four-mile-per-hour breeze out of the southwest. Nothing to move the needle. Strikeout markets look thin. Rodriguez projects at 3.8 strikeouts against a line of 4.0, grading as neutral with medium confidence. Irvin projects at 2.6 against the same 4.0 line, a clear lean to the under with the same medium-confidence tag. Neither pitcher offers a standout K profile in this spot, and the models reflect that uncertainty. Rodriguez has posted a 63 percent NRFI rate across 19 first-inning samples, while Irvin checks in at 65 percent over 20 outings. Both figures sit above the recent park trend, but sample size and recent venue performance pull in opposite directions. The NRFI debate hinges on whether you trust individual pitcher history or the hot park data.
Rodriguez 6.28ERA faces Irvin 5.52ERA at Nationals Park
Nationals Park has averaged 9.9 runs over last 10 games
Irvin strikeout projection 2.6 leans under his 4.0 line
On the season, Riley Cornelio holds the ERA edge in this matchup. Grayson Rodriguez carries a 6.10ERA and 1.56WHIP, while Riley Cornelio sits at 4.88ERA and 1.55WHIP. Strikeout rates: Grayson Rodriguez at 8.17K/9, Riley Cornelio at 10.08K/9. K projections: Grayson Rodriguez at 3.9 (line 4.5) Riley Cornelio projected at 2.3 (line 4.0). Grayson Rodriguez has a 65.4% career NRFI rate. No first-inning data available for Riley Cornelio. Both starters throw from the R side, limiting platoon splits for either lineup.
Our strikeout model weighs pitcher K rate, opponent lineup whiff tendency, park factors, and umpire zone size to project total strikeouts per starter.
Grayson Rodriguez (Los Angeles Angels) is projected for 3.9 strikeouts against a posted line of 4.5. The projection is close to the line with no actionable edge. He faces a high-K lineup that strikes out at 24.6% with a 28.0% whiff rate.
Riley Cornelio (Washington Nationals) is projected for 2.3 strikeouts against a posted line of 4.0. The projection sits 1.7 K below the line, giving the model an Under lean. He faces a high-K lineup that strikes out at 27.1% with a 28.0% whiff rate.
The Los Angeles Angels lineup is more vulnerable to strikeouts in this matchup. Washington Nationals batters K at 24.6%, Los Angeles Angels batters at 27.1%.
Our NRFI model analyzes both starting pitchers' first-inning profiles, the top-of-order hitters in each lineup, the umpire's historical zone, and environmental factors to produce a probability estimate. For this game, the model assigns a 44.1% probability of no runs in the first inning, compared to the market's implied probability of 48.5%.
That creates a slim -4.5% edge on YRFI.
The best available line is NRFI +106 / YRFI -130 at FanDuel.
Home plate umpire Todd Tichenor runs a average zone. See the umpire section below for full career data.
Our NRFI model sits at 154-138 (52.7%) on official picks this season.
Nationals Park carries a 0.99 run factor (neutral).
Home run factor: 0.96 — the park neutral for HR power.
Park notes: Potomac River proximity; Humid DC climate; Relatively neutral dimensions.
First pitch forecast: 81F with 2 mph winds from the W. Humidity: 75%.
Temperature drops from 81F at first pitch to 86F by the late innings.
Calm wind conditions. Minimal impact on ball flight.
Home plate umpire: Todd Tichenor.
Career NRFI rate: 12.5% across 8 games tracked.
Zone tendency: Slightly wide.
K factor: 0.858 (below average strikeouts in his games).
Run Projections & Total
Our projection model puts the total at 5.5 combined runs, with Los Angeles Angels projected for 2.6 and Washington Nationals for 2.9.
That's 4.0 runs below the posted total of 9.5, suggesting a lean toward the Under.
The run projection favors Washington Nationals by 0.3 runs.
The Bottom Line
This matchup offers limited edges. The strikeout model leans under on Irvin at 2.6 projected versus a 4.0 line, but confidence sits at medium and the gap is not enormous. Rodriguez grades neutral on his K prop. The NRFI presents a puzzle: both pitchers carry individual rates above 60 percent, yet Nationals Park has seen first-inning runs 70 percent of the time in the last 10 contests. That split makes it hard to establish conviction either way. The total and side markets lack model-derived angles worth citing. Both bullpens are equally worn, and the park factor is dead neutral. If forced to isolate a lean, the Irvin strikeout under offers the cleanest numerical edge, but it's thin. Most bettors will find better spots elsewhere on the card.
This preview is generated from thecapper.io projection models and publicly available data. All projections are model estimates, not guarantees. Gamble responsibly. If you or someone you know has a gambling problem, call 1-800-GAMBLER.