Beta Free full access during beta. All models, tools, and daily picks included.
Early Preview Lineups: Confirmed Odds Posted 7 min read

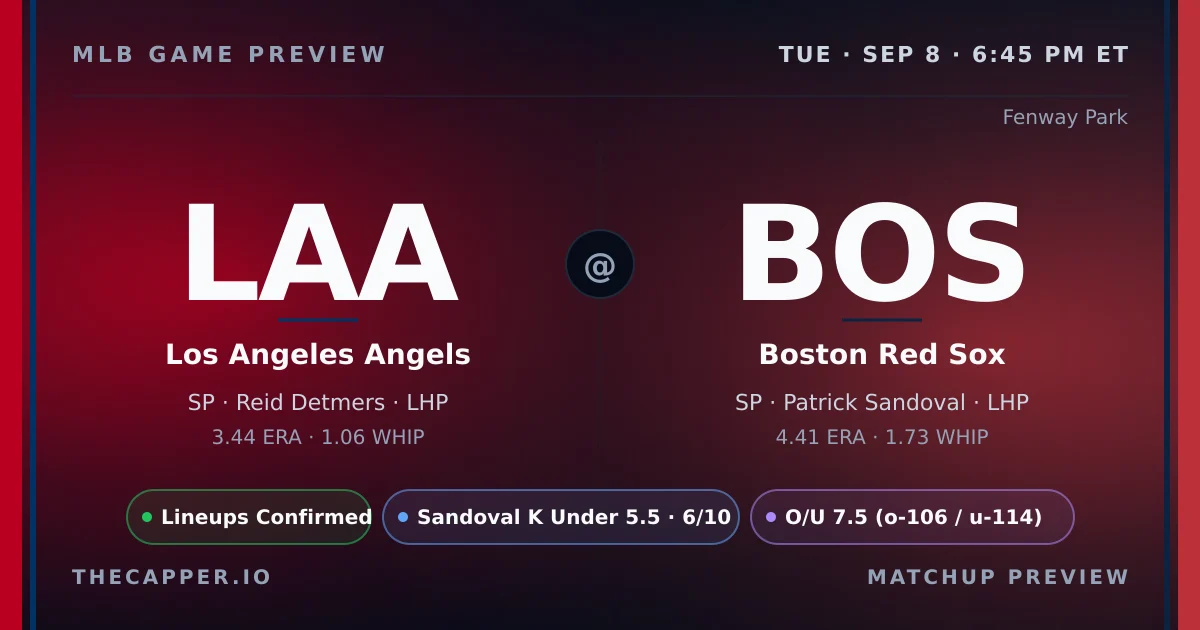
Los Angeles Angels vs Boston Red Sox Preview

LAA at BOS 2026-09-08 preview: probable pitchers, projected lineups, NRFI/F5 model picks, weather, ballpark, and umpire context.

Los Angeles Angels at Boston Red Sox MLB game preview for September 8, 2026
LAA
Los Angeles Angels
Reid Detmers LHP
@
6:45 PM ET
Fenway Park
BOS
Boston Red Sox
Patrick Sandoval LHP
Last updated Tuesday, September 8, 2026
Final This game has finished. Read the recap for final score, model grades, and box score.

Key Facts

Matchup
Los Angeles Angels at Boston Red Sox
Date
Tuesday, September 8, 2026
First Pitch
6:45 PM ET
Venue
Fenway Park
Probable Starters
Reid Detmers (LHP) vs Patrick Sandoval (LHP)
Lineups
Confirmed
Odds Snapshot
Sep 8, 6:46 PM ET
Last Updated
Sep 8, 7:27 AM ET

Betting Board

Snapshot Sep 8, 6:46 PM ET
Moneyline
LAA +131
BOS -140
Total
Over 7.5 -106
Under 7.5 -114
Run Line
LAA +1.5 -176
BOS -1.5 +146

Model Angles

NRFI Model
NRFI · 56%
+4.6% edge · playable
Projected Total
5.3
model combined runs
Park Factor
1.08
Hitter friendly · HR 1.15
First Pitch Weather
70°F
6.5 mph E
The Angels visit Fenway Park on Friday evening in a matchup that sits outside the playoff conversation but offers a clear edge in the first-inning market. Reid Detmers takes the ball for Los Angeles with a 3.44 ERA, 1.06 WHIP, and 10.11 strikeouts per nine. Patrick Sandoval counters for Boston with a 4.41 ERA and 1.73 WHIP. The surface numbers diverge, but the NRFI database tells a more unified story. Detmers has posted a 77 percent NRFI rate across 31 first-inning starts this season. Sandoval matches that discipline with an 80 percent mark over 10 first-inning outings. The model gives the NRFI a 56 percent probability and assigns a 5.5 percent edge at the pick-time price. That combination of historical consistency and model-driven edge makes this the sharpest angle in a contest that otherwise sits near projection. Boston enters on a five-game winning streak and holds an 80-65 record. Los Angeles sits at 54-90 and has dropped its last two. The barrel-rate leaders on each side add moderate intrigue. Zach Neto carries a 17.0 percent barrel rate for the Angels, while Mike Trout checks in at 14.8 percent. Boston counters with Moisés Ballesteros and his 17.9 percent mark. Fenway Park has recorded a 60 percent NRFI rate over its last 10 games, supporting the read on this matchup. The projected total lands at 5.3, with the home side favored narrowly at 2.7 to 2.6. Weather forecasts 70 degrees with an eight-mile-per-hour wind out of the east-northeast. Both bullpens carry identical fatigue scores of 61 out of 100, leaving little separation beyond the starters. That keeps the focus squarely on the first inning, where the data converges.
  • Starter matchup: Reid Detmers (Los Angeles Angels) vs Patrick Sandoval (Boston Red Sox).
  • Lineup status: confirmed by both teams.
  • NRFI model: 56% probability, lean NRFI, +4.6% edge.

Pitching Matchup

LAA Away
Reid Detmers
LHP · 4-8 · 28 GS
ERA
3.44
WHIP
1.06
K/9
10.11
IP
162.0
Career: 4.42 ERA · 1.28 WHIP · 10.01 K/9
NRFI: 78.2%
1st Inn ERA: 3.44
BOS Home
Patrick Sandoval
LHP · 1-4 · 10 GS
ERA
4.41
WHIP
1.73
K/9
9.18
IP
49.0
Career: 4.05 ERA · 1.42 WHIP · 8.91 K/9
NRFI: 76.8%
1st Inn ERA: 3.88

On the season, Reid Detmers holds the ERA edge in this matchup. Reid Detmers carries a 3.44 ERA and 1.06 WHIP, while Patrick Sandoval sits at 4.41 ERA and 1.73 WHIP.
Strikeout rates: Reid Detmers at 10.11 K/9, Patrick Sandoval at 9.18 K/9.
K projections: Reid Detmers at 4.7 (line 5.5)
Patrick Sandoval projected at 4.2 (line 5.5).
First-inning scoring: Reid Detmers holds a 78.2% career NRFI rate, Patrick Sandoval at 76.8%. Combined average: 77.5%.
Both starters throw from the L side, limiting platoon splits for either lineup.

Strikeout Projections

Reid Detmers vs BOS
Proj: 4.7Line: 5.5
-0.8
Confidence:
Patrick Sandoval vs LAA
Proj: 4.2Line: 5.5
-1.3
Confidence:
View all K projections on SlateIQ

Our strikeout model weighs pitcher K rate, opponent lineup whiff tendency, park factors, and umpire zone size to project total strikeouts per starter.

Reid Detmers (Los Angeles Angels) is projected for 4.7 strikeouts against a posted line of 5.5. The projection is close to the line with no actionable edge.
He faces a high-K lineup that strikes out at 25.3% with a 28.0% whiff rate.

Patrick Sandoval (Boston Red Sox) is projected for 4.2 strikeouts against a posted line of 5.5. The projection sits 1.3 K below the line, giving the model an Under lean.
He faces a high-K lineup that strikes out at 31.0% with a 28.0% whiff rate.

The Los Angeles Angels lineup is more vulnerable to strikeouts in this matchup. Boston Red Sox batters K at 25.3%, Los Angeles Angels batters at 31.0%.

NRFI & First 5 Analysis

NRFI Model
56.1%
probability of NRFI
+4.6%
market edge
Signal
Market implied: 51.5%Model: 56.1%
First 5 Innings
2.9est. F5 runs
LAA
3.44 ERA
5.8 inn/start
BOS
4.41 ERA
4.9 inn/start
F5 lean: Slight LAA
LAA K Projection
Reid Detmers
4.7proj
Line: 5.5
-0.8 NEUTRAL
Confidence
BOS K Projection
Patrick Sandoval
4.2proj
Line: 5.5
-1.3 UNDER
Confidence
Explore all model projections

Our NRFI model analyzes both starting pitchers' first-inning profiles, the top-of-order hitters in each lineup, the umpire's historical zone, and environmental factors to produce a probability estimate. For this game, the model assigns a 56.1% probability of no runs in the first inning, compared to the market's implied probability of 51.5%.

  • That creates a slim 4.6% edge on NRFI.
  • The best available line is NRFI -106 / YRFI -114 at FanDuel.
  • This qualifies as a playable in our publication system.
  • Home plate umpire Bruce Dreckman runs a average zone. See the umpire section below for full career data.
  • Our NRFI model sits at 148-132 (52.9%) on official picks this season.

Prop Edges

3 model signals detected
Mike TroutStrong Signal
Home Run Elite 0.5
15.2%
Home Run Elite 0.5
15.2%
Patrick Sandoval
Strikeouts Under 5.5
See all today's picks and edges

Lineup & Matchup Breakdown

Los Angeles Angels Confirmed
K%: 31.0
1Zach NetoRSS
2Mike TroutRCF
5Moisés BallesterosLDH
Whiff rate: 28.0%Team page
Boston Red Sox Confirmed
K%: 25.3
2Jahmai JonesRDH
Whiff rate: 28.0%Team page
Batter vs Pitcher matchup tool

Lineups are confirmed as of this writing.

Los Angeles Angels K vulnerability: 31.0% strikeout rate, 28.0% whiff rate.

Boston Red Sox K vulnerability: 25.3% strikeout rate, 28.0% whiff rate.

Ballpark, Weather & Umpire

Fenway Park
Run Factor1.08
HR Factor1.15
Full park profile
Home Plate Umpire
Bruce Dreckman
Wide NRFI: 50.0% 8 games
Full umpire profile
Hourly Game Forecast
70°
6 PM
7 mph
E
70°
7 PM
3 mph
E
70°
8 PM
3 mph
E
70°
9 PM
3 mph
E
  • Fenway Park carries a 1.08 run factor (hitter-friendly).
  • Home run factor: 1.15 — the park elevates HR power.
  • Park notes: Green Monster (37ft wall in left field); Pesky's Pole (302ft in right field); Triangle in center field.

First pitch forecast: 70F with 6 mph winds from the E. Humidity: 69%.

  • Home plate umpire: Bruce Dreckman.
  • Career NRFI rate: 50.0% across 8 games tracked.
  • Zone tendency: Wide.
  • K factor: 1.111 (above average strikeouts in his games).

Run Projections & Total

  • Our projection model puts the total at 5.3 combined runs, with Los Angeles Angels projected for 2.6 and Boston Red Sox for 2.7.
  • That's 2.2 runs below the posted total of 7.5, suggesting a lean toward the Under.
  • The run projection is essentially a coin flip between these two teams.
The Bottom Line
The NRFI is the clear focal point. The model assigns a 56 percent probability and a 5.5 percent edge, and the historical NRFI rates for both starters sit above 75 percent. The risk is the same as in any first-inning bet: a single mistake pitch, a bases-loaded walk, or a defensive lapse can erase the edge in one swing. Sandoval's 1.73 WHIP suggests traffic, even if he limits damage. The barrel-rate talent on both rosters is real. Still, the combination of database support, model edge, and recent park trends points toward the NRFI as the sharpest lean available in this matchup.
This preview is generated from thecapper.io projection models and publicly available data. All projections are model estimates, not guarantees. Gamble responsibly. If you or someone you know has a gambling problem, call 1-800-GAMBLER.